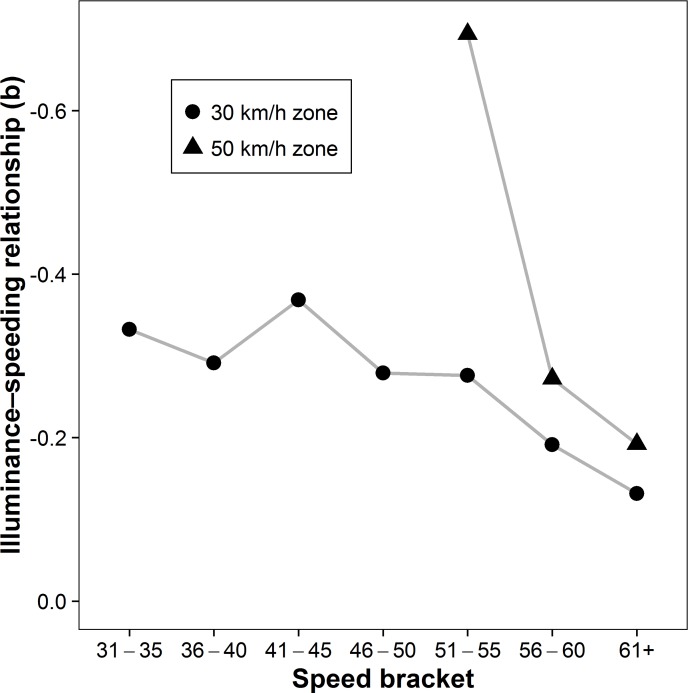
Fig 3. The illuminance‒speeding relationship across speed brackets.
For both 30 km/h and 50 km/h zones, we calculated separate regression analyses for each speed bracket. The y-axis indicates non-standardized regression coefficients and is reversed for ease of interpretation (i.e., higher numbers indicate a stronger negative relationship). Across speed brackets, we found support for the inverse illuminance‒speeding relationship. While the strength of the relationship declined with increasing speeding rates, all regression coefficients were significant at p < .001.

