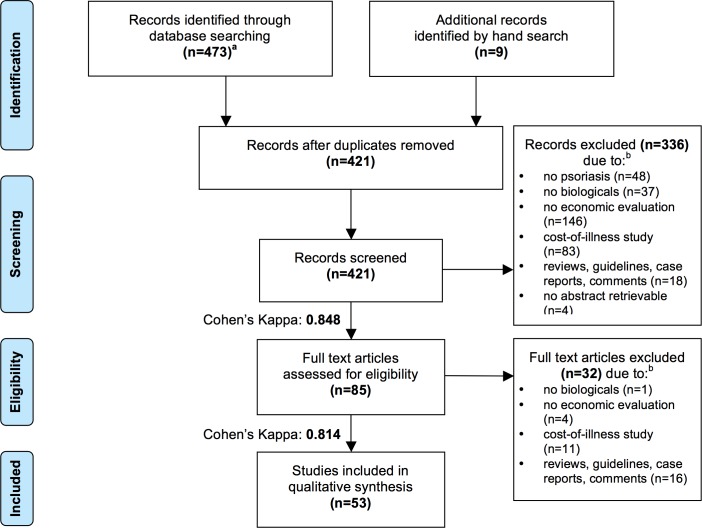
Fig 1. PRISMA Flow Diagram.
a PubMed (n = 395), Cochrane (n = 68), LILACS (n = 6), EconLit (n = 4); period of search: from databases’ inceptions until 30/06/2017. b If more than one exclusion criterion applied, the record was assigned to the first applicable category in the order shown in the figure.

