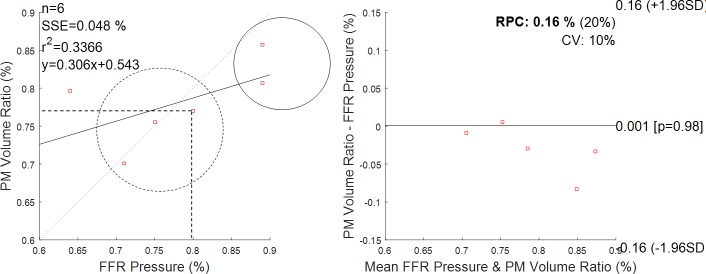
Fig 12. Volume reduction as from proposed method (PM) and measured pressure gradient (FFR measurement).
On the left, the regression line between the two methods. Dashed circle encloses positive FFR clinical outcomes; solid circle encloses negative FFR clinical outcomes. Dashed lines indicate that the cut-off of 0.8 in FFR corresponds to a cut-off of 0.77 in volume drop. On the right, the Bland-Altman plot. Reproducibility coefficient and % of mean values RPC (%) = 0.16% (20%); coefficient of variation CV = 10%. The solid line represents the mean of the differences.

