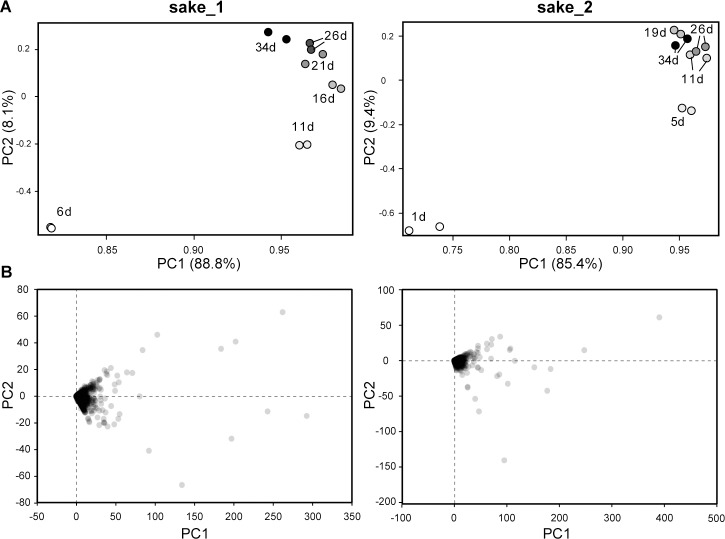
Fig 1. PCA analysis of metabolic profiles.
(A) Score plot of the fermentation process. Metabolic profiles of samples at six time points were plotted using two analytical replicates from the same sample. (B) Loading scatter plot. Factors having values of PC1 from the top to the 20th at each plot are shown in Table 1.

