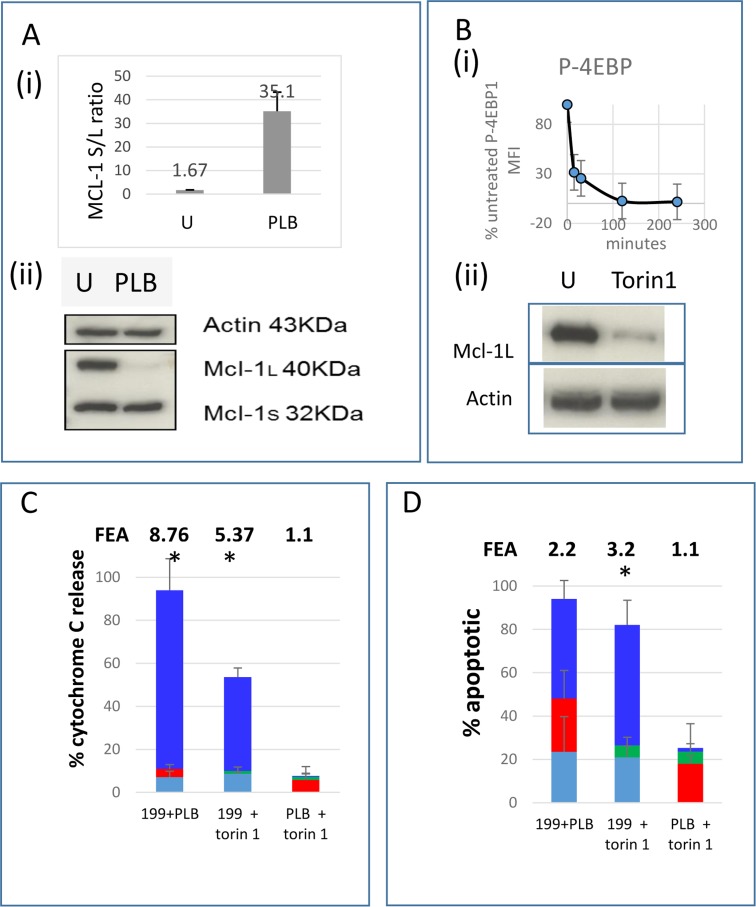
Fig 3. Co-operative induction of apoptosis by ABT-199 with pladienolide B or torin1.
(A) MCL-1 long form (L) and short form (S) transcripts (i) and protein (ii) were quantified in untreated cells and cells treated with 10 nM pladienolide B (PLB) for 4 hours. (B) 4E-BP1 phosphorylation (i) and MCL-1 protein (ii) were quantified in untreated cells and cells treated with 1μM torin1 for 4 hours. (C, D) Cells were incubated with 10 nM ABT-199 (199, turquoise), 10 nM pladienolide B (PLB, red), 1 μM torin1 (green) or the indicated combinations (bright blue bar, height = effect with both agents in combination–sum of effects with agents individually). (C) After 4 hours cells were fixed and processed for Cytochrome C release. (D) After 4 hours DiOC6 was added for a further 75 minutes and 7-amino actinomycin D for the last 30 minutes. (Mean+/- SD for n = 3). Fold excess additivism (FEA) is shown on the figures and was calculated as a ratio of observed to expected values after corrections according to the Bliss algorithm (see methods). Asterisks indicate observed values significantly higher than expected values (P<0.05).

