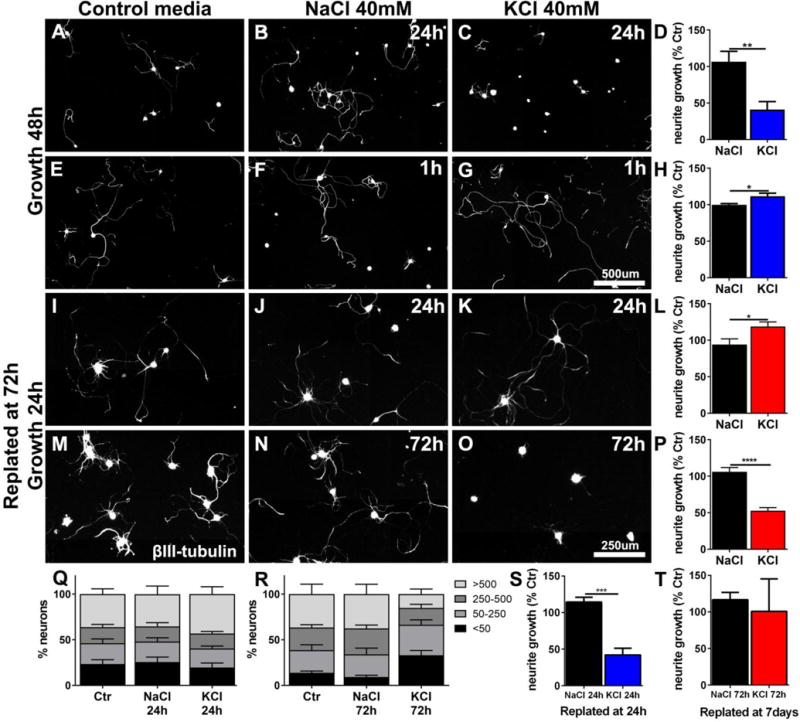
Figure 1. KCl depolarization can inhibit or enhance DRG neurite growth.

Naïve DRGs were isolated and cultured on PDL/Laminin (0.5μg/μl) for either (A-H) 48h, or (I-R) were replated at 72h and cultivated for an additional 24h. KCl was added to the culture medium, at the beginning of incubation, for (C) 24h or (G) 1h, and (K) 24h and then washed out and replaced with regular medium. (O) DRGs were kept in media with KCl for 72h and then immediately replated. Controls wells were incubated in (A, E, I, M) media only or (B, F, J, N) received NaCl (40mM) for osmolarity control for the same time as the KCl-treated DRGs. The longest ßIII-tubulin-labeled neurite was quantified. Average neurite length is expressed as % of control (176±80 neurons/well) (A-D) Growth is inhibited when DRGs are incubated in KCl for 24h (n=5–6 wells, 2 independent experiments). However, if (E-H) incubation is shorter (1h), total growth is enhanced (n=9–10 wells, from 3 independent experiments). (I-L) If DRGs are exposed to KCl for 24h then changed to normal media and replated at 72h in normal media, growth is enhanced (4 independent experiments). (M-P) If DRGs are exposed to KCl for 72h then replated in normal media, growth is inhibited (3 independent experiments). (Q) Neurons exposed to KCL for 24h and replated at 72h were classified by their longest neurite length (<50μm, 50–250μm, 250–500μm and >500μm) and expressed as % of the total number of neurons per condition. (R) The same classification for neurons exposed to KCl for 72h and immediately replated shows an increase in the percentage of neurons with very short neurites. (S) Growth is inhibited when 24h KCl exposed neurons were replated directly (n=3, 108±24neurons/well, 1-way ANOVA) (compare to L), (T) 72h KCl exposure is no longer inhibitory when cells are replated at 7 days (n=3, 159±35neurons/well) (compare to P). Bars represent means+SEM, One-way ANOVA, Sidak´s posthoc test, ∗p<0.05, ∗∗p<0.01, ∗∗∗p<0.001.
