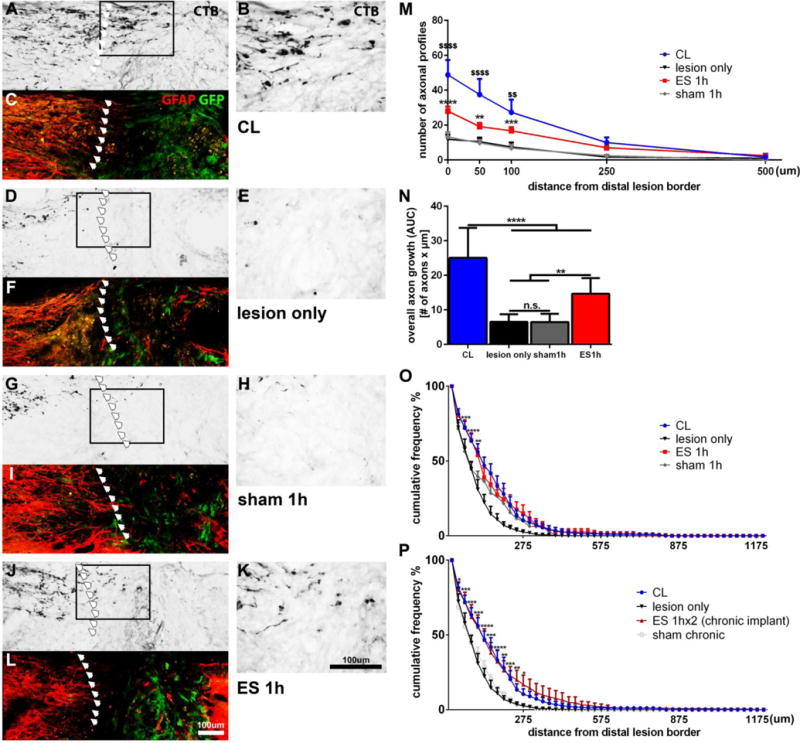
Figure 4. Axonal growth 4 weeks after dorsal column lesions (DCL) and single or repeated 1h ES.

Following transection of ascending sensory axons at C4 and injection of GFP+ BMSCs into the lesion, animals received (A-C) bilaterally conditioning lesions, (D-F) no other manipulation, (G-I) electrodes with no stimulation or (J-L) electrical stimulation. (C, F, I, L) CTB-labeled axons were quantified at the caudal GFAP border (red) and within the lesion site filled with GFP+ BMSCs (green). Arrows mark the caudal lesion border. (B, E, H, K) Higher magnifications of boxed areas shown in (A, D, G, J). (M) The number of axonal profiles at different distances from the lesion site was quantified in 1 out of 8 serial sagittal sections. Significant differences between CL and lesion only animals ($$p<0.01, $$$$ p<0.0001), and between ES and sham animals (**p<0.01, ***p<0.001, ****p<0.0001) are indicated. (N) Overall axon growth (area under the curve; AUC) into the graft shows the highest growth in animals with CLs and a smaller but significant effect after ES. (O, P) The distance of CTB-labeled growth cones/axon tips within the graft was quantified from the caudal GFAP/GFP border. (O)The percentage of axons extending for a longer distance into the graft is significantly increased in ES compared to lesion only and sham animals. Sham 1h also shows an effect compared to lesion only. Significance shown for ES 1h versus sham 1h. (P) The percentage of axons that achieve growth over a longer distance into the graft is significantly increased in ES 1hx2 compared to lesion only and sham chronic. n=6–7/group, 2-way ANOVA, Tukey´s posthoc test. Mean ± SEM, *p<0.05, **p<0.01, ***p<0.001, ****p<0.0001. For comparison, naïve and CL animals shown in (O) are also shown in (P).
