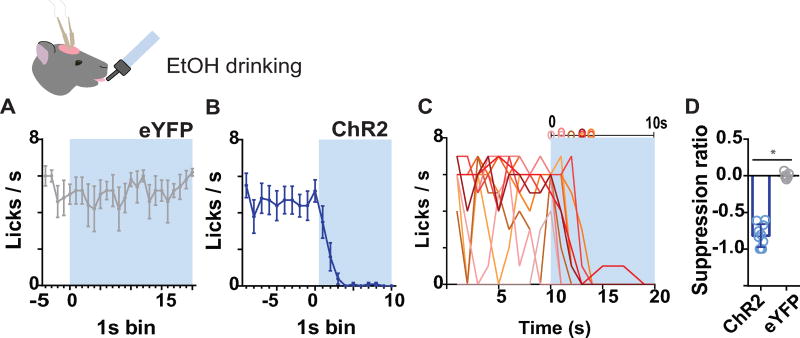
Figure 3. Photoactivation of BLA terminals in AcbSh arrests alcohol intake (ChR2, N=9; eYFP, N=8).
(A) Mean (±SEM) number of licks across 1s time bins during pre-stimulation baseline and on the first 20s of photoactivation for control group eYFP, which received 120s photoactivation (N=6). (B) Mean (±SEM) number of licks across 1s time bins during pre-stimulation baseline and on the first 10s of photoactivation for ChR2. (C) Licks/sec for individual animals in group ChR2. (D) Mean (±SEM) lick suppression ratio.

