
Figure 3. Defining an evolutionarily conserved ciliome.
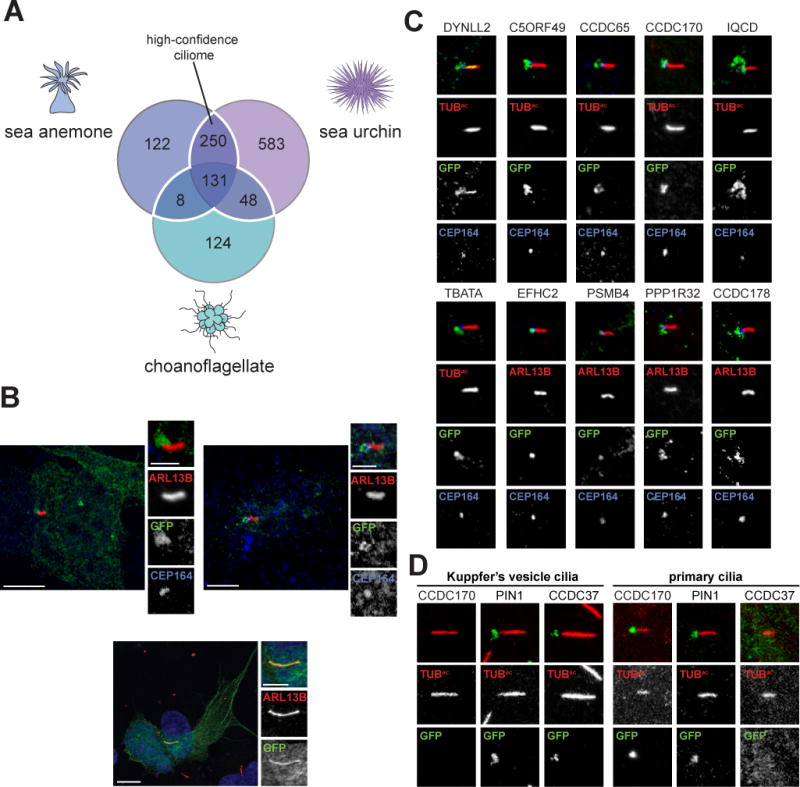
(A) Venn diagram of the overlap of S. purpuratus, N. vectensis and S. rosetta ciliomes. The white line encompasses the high-confidence ciliary proteins present in 2 or more ciliomes. Only proteins that possess a mouse homolog (BLAST E value ≤ 1e-5) are included. (B) Immunofluorescent staining for cilia (ARL13B, red) and candidate proteins fused to GFP (green) expressed in IMCD3 cells. Human C4orf47-GFP localizes to cilia and cytoplasmic microtubules. Fusions of human CSNK1D and CCDC113 with GFP predominantly co-localize with the basal body component CEP164 (blue). For C4orf46-GFP, nuclei are stained with Hoechst (blue). Scale bar for whole cell images, 5 μm. Scale bar for cilia only images, 2.5 μm. (C) Ten GFP-tagged human proteins, out of 49 randomly selected proteins from the high-confidence ciliome, localize to cilia or the ciliary base of IMCD3 cells. Immunofluorescent staining marks GFP-tagged proteins (green), cilia are indicated by ARL13B or TUBac (red), as indicated, and the basal body is highlighted by CEP164 (blue). Scale bar, 2.5 μm. (D) Immunofluorescent staining of human proteins fused to GFP (green) in the D. rerio embryo (somite stage 6–10). Cilia are marked by staining for TUBac (red). Cilia from within the Kuppfer’s vesicle and primary cilia found outside the Kuppfer’s vesicle are depicted. Scale bar, 2.5 μm. (See also Figure S1, S3, Table S3, S4 and S5).