
Figure 6. ENKUR is required for left-right axis patterning in mice.
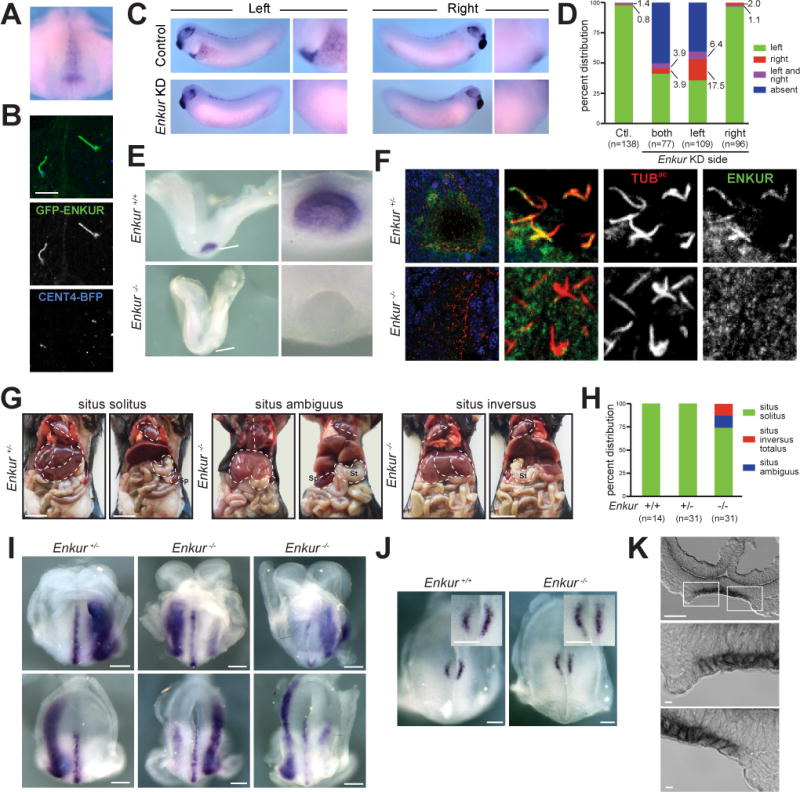
(A) Whole mount in situ hybridization of a stage 17 X. laevis embryo for Enkur. Ventral view of dorsal resection of embryo. Only the posterior region of the embryo is shown. Enkur is expressed in the gastrocoel roof plate (GRP). (B) Fluorescence imaging of X. laevis GRP cilia expressing GFP-ENKUR (green) and CENT4-BFP (blue). CENT4-BFP marks basal bodies. Scale bar, 5 μm. (C) In situ hybridization for Pitx2c of a stage 28 X. laevis control embryo and an Enkur knockdown (KD) embryo. Pitx2c is expressed in the left lateral plate (arrowhead and high magnification image) of control embryos but is absent in the Enkur KD embryo. (D) Quantification of Pitx2c expression patterns in control and Enkur KD embryos. (E) In situ hybridization of 2–4 somite stage littermate control and Enkur−/− mouse embryos for Enkur. At this stage, Enkur is expressed exclusively in the node. Enkur−/− embryos do not express detectable Enkur. Scale bar for left panel, 50μm. Scale bar for right panel, 25 μm. (F) Immunofluorescence staining of 2–4 somite stage mouse embryos for ENKUR (green) and cilia (TUBac, red). ENKUR localizes to the cilia of the node and is not detectable in the cilia of Enkur−/− nodes. Nuclei are stained with Hoechst (blue). Scale bar for left panels, 10 μm. Scale bar for right 6 panels, 2.5 μm. (G) Photographs of thoracic and abdominal organ positions. The right (R) and left (L) side of the body are indicated. Some Enkur−/− mice display situs ambiguus, illustrated here by abnormal heart apex orientation, midline liver and right-sided spleen. Some Enkur−/− mice display situs inversus, a complete reversal of the left-right axis. Scale bar, 1 cm. (H) Quantification of situs in littermate control and Enkur−/− mice. (I) In situ hybridization of 3–5 somite stage littermate control and Enkur−/− embryos for Lefty2. Upper panels are rostral views. Lower panels are caudal views. The right (R) and left (L) side of the embryo are indicated. Control embryos exhibit Lefty2 expression in the midline and left lateral plate mesoderm. Enkur−/− embryos exhibit variable patterns of Lefty2 expression, including expression predominantly in the right lateral plate mesoderm (middle) or partially in the right lateral plate mesoderm (right). Scale bar, 50 μm. (J) In situ hybridization of 3–5 somite stage littermate control and Enkur−/− embryos for Cerl2. The right (R) and left (L) side of the embryo are indicated. Control embryos display an enrichment of Cerl2 expression on the right side of the node. Enkur−/− embryos express equal levels of Cerl2 on both sides of the node. Scale bar, 100 μm. (K) Cryosectioned in situ hybridization of 2–4 somite stage mouse embryo for Enkur. Top panel depicts the entire node and lower two panels depict areas indicated by white boxes. Enkur is expressed predominantly within the pit cells (pc) and not the crown cells (cc) of the node. Scale bar top panel, 50 μm. Scale bar bottom two panels, 5 μm. (See also Figure S5 and Movie S2).