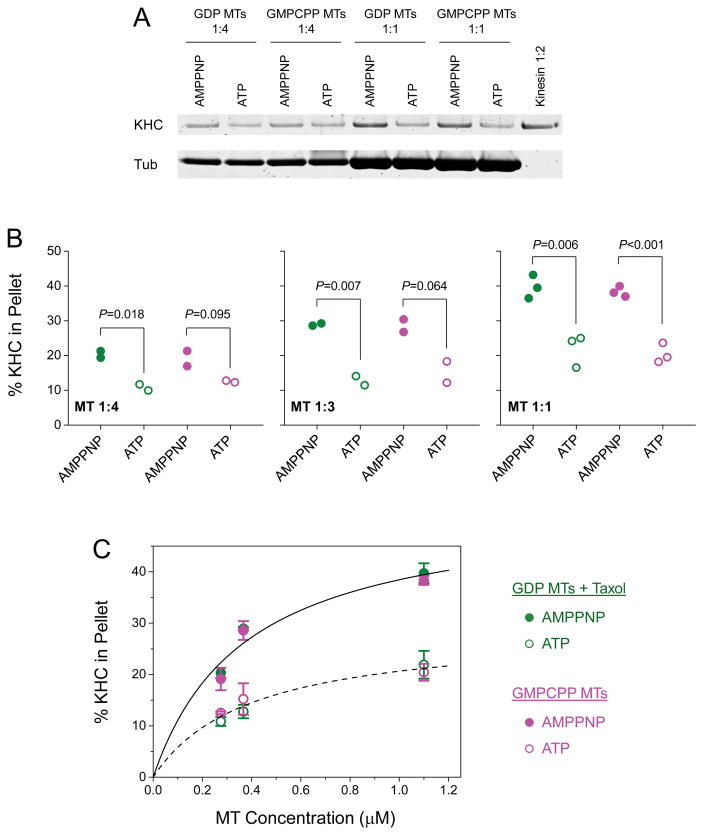
Figure 6. Native kinesin-1 does not preferentially co-sediment with GTP-tubulin-rich microtubules (MTs).
Co-sedimentation was measured using bead-independent MT-affinity pulldown assays. Taxol (25 μM) was included in assays using GDP MTs. Assays using GMPCPP MTs were free of taxol. (A) Example co-sedimentation assays at two microtubule concentrations (1:1 and 1:4, corresponding to 0.28 and 1.1 μM MT, respectively), and in the presence of 5 mM AMPPNP or 5 mM ATP as indicated. KHC, kinesin heavy chain; Tub, tubulin. Dilution of kinesin reference solution (1:2) corresponds to 50% of the input kinesin. The un-cropped image of this gel is shown in Figure S4. (B) Dot plot of the fraction of KHC signal in the MT pellet, measured for three MT concentrations (1:4, 1:3, and 1:1; corresponding to 0.28, 0.37, and 1.1 μM MT, respectively). Green solid (or open) circle, assays using taxol-stabilized GDP MTs at 5 mM AMPPNP (or 5 mM ATP). Magenta solid (or open) circle, assays using taxol-free GMPCPP MTs at 5 mM AMPPNP (or 5 mM ATP). P-value is determined using Student’s t-test. (C) Mean and standard error of KHC measurements in (B), as a function of MT concentration. Solid line, best fit of KHC signal in the presence of AMPPNP (averaged between MT types) to the Hill equation. Dashed line, best fit of KHC signal in the presence of ATP (averaged between MT types) to the Hill equation.

