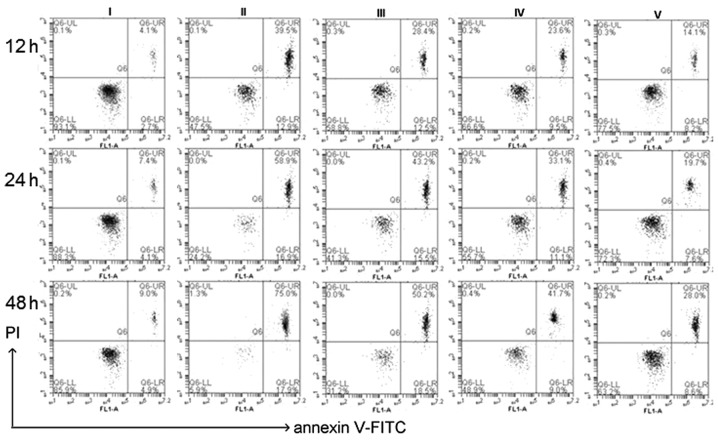
Figure 8.
Apoptotic analysis of isolated lens epithelial cells by flow cytometry after staining with Annexin V/PI. Cells were treated untreated (blank; I) or treated with 500 µM H2O2 (control) plus different concentrations of chlorogenic acid [0 µM (II), 10 µM (III), 30 µM (IV), 50 µM (V)]. At the indicated time-points (i.e., 12, 24 and 48 h), the apoptosis rates were (II): 51.8±3.81, 77.2±4.12 and 94.57±4.77%; (III): 42.3±3.76, 58.3±3.67 and 65.9± 4.12%; (IV): 33.7±2.95, 42.3±3.29 and 50.43±4.13%; (V): 22.4±1.09, 28.5±2.54 and 39.2±3.71% of control value. Data are expressed as the mean ± standard deviation. P<0.01 blank vs. II, III, IV, V; P<0.01 control vs. I, III, IV, V; one-way analysis of variance and followed by Tukey's honest significant difference post hoc test). PI, propidium iodide; FITC, fluorescein isothiocyanate.

