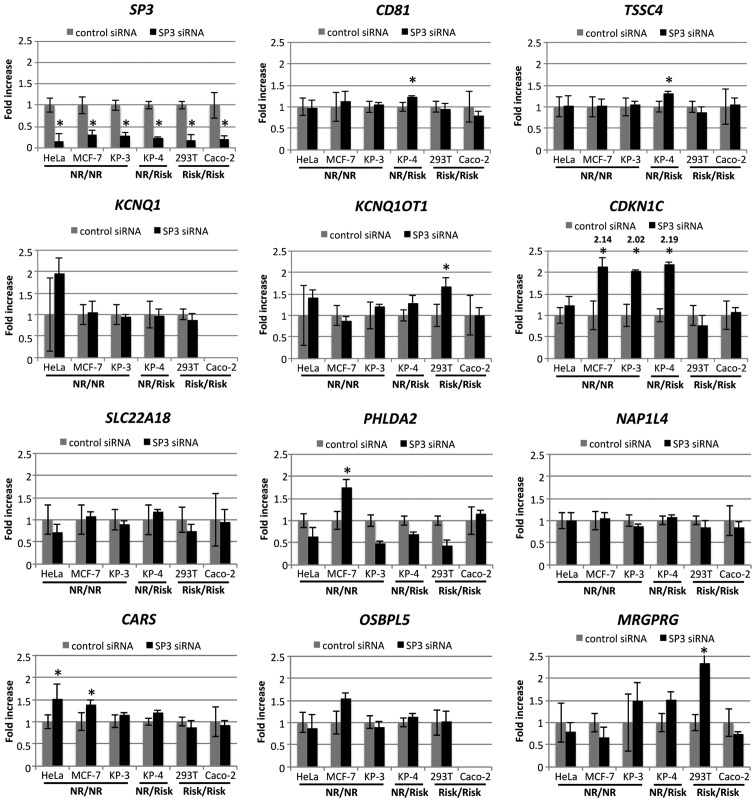
Figure 6.
Effect of SP3 knockdown on the expression of KCNQ1 and nearby genes. Cell lines were transfected with control siRNA or siRNA that targeted human SP3. Gene expression levels were determined by reverse transcription-quantitative polymerase chain reaction analysis and normalized to β-actin. The expression level of each gene using negative control siRNA was designated as 1.0 in each cell line. The data for TRPM5 and SLC22A18AS from all cell lines, as well as the data for KCNQ1 and OSBPL5 from Caco-2 cells, have been excluded because of the limit of detection. *P<0.01 vs. negative control siRNA samples. siRNA, small interfering RNA; NR, non-risk.

