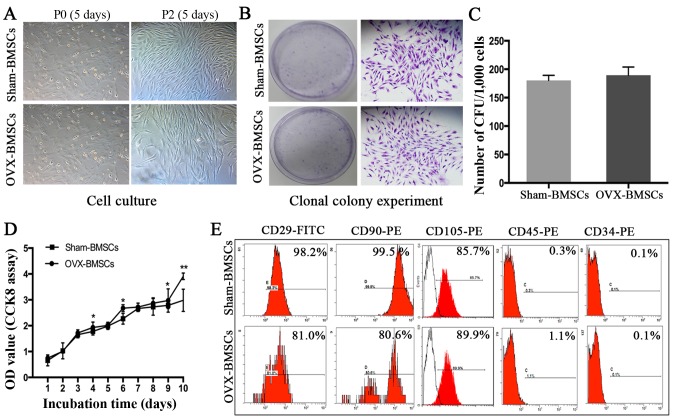
Figure 2.
Isolation and characterization of Sham-BMSCs and OVX-BMSCs. (A) Representative images of phase-contrast photomicrographs of primary cells at P0 and P2 (×40 magnification). (B) Representative images of the number of CFUs formed by Sham-BMSCs and OVX-BMSCs following culture for 12 days (×40 magnification). (C) Quantitative analysis of the number of CFUs formed by Sham-BMSCs and OVX-BMSCs (n=7). (D) Proliferative capacity of Sham-BMSCs and OVX-BMSCs evaluated by CCK-8 assay (n=7). (E) Representative images of cell surface marker expression in Sham-BMSCs and OVX-BMSCs. Data are shown as the mean ± standard deviation. *P<0.05 for Sham-BMSCs vs. OVX-BMSCs. BMSCs, bone marrow mesenchymal stem cells; OVX, ovariectomy; P0, passage 0; P2, passage 2; CFU, colony-forming unit; CCK-8, Cell Counting kit-8; OD, optical density; CD, cluster of differentiation.

