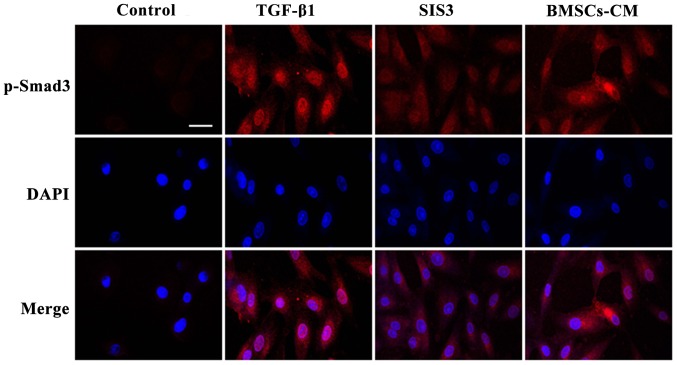
Figure 9.
Localization of p-Smad3 occurs in the cells as shown by immunofluorescence. p-Smad3 is shown in red, TRITC-stained; counterstaining of nuclei with DAPI is shown in blue. Scale bar, 50 μm. The cell groups were as follows: control, cells cultured in serum-free DMEM; TGF-β1, cells cultured in serum-free DMEM and exposed to 5 ng/ml TGF-β1; SIS3, cells were treated with 3 μM SIS3 (specific inhibitor of Smad3) which was added 4 h prior to 5 ng/ml TGF-β1 exposure. TRITC, tetramethylrhodamine isothiocyanate; DAPI, 4′,6-diamidino-2-phenylindole.

