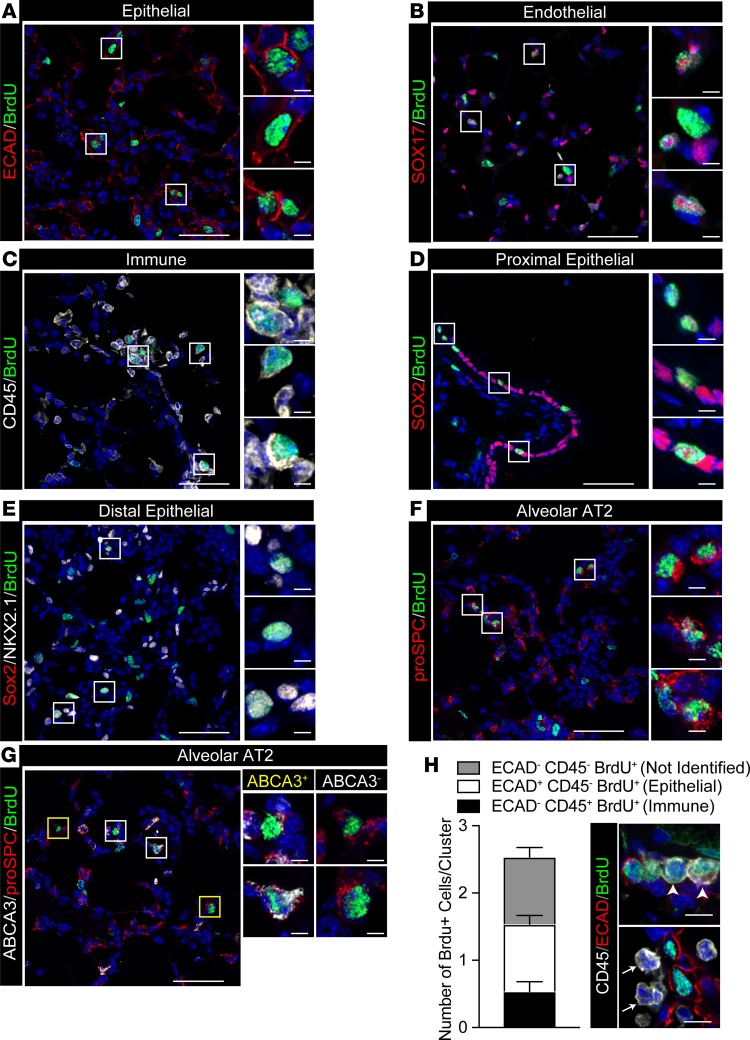
Figure 7. Proliferating cells after deletion of Abca3.
Representative confocal immunofluorescence images of proliferating cell clusters analyzed in Figure 6. (A) ECAD+ (red) and BrdU+ (green) epithelial cells, (B) SOX17+ (red) and BrdU+ (green) endothelial cells, (C) CD45+ (white) and BrdU+ (green) immune cells, (D) SOX2+ (red) and BrdU+ (green) proximal epithelial cells, (E) SOX2+ (red), NKX2.1+ (white) and BrdU+ (green) distal epithelial cells, (F) proSPC+ (red) and BrdU+ (green) alveolar AT2 cells, and (G) ABCA3+ (white), proSPC+ (red) and BrdU+ (green) cells. Representative ABCA3+ and ABCA3– AT2 cells are shown in yellow and white boxes, respectively. Scale bars: 50 μm. Inset scale bars: 5 μm. (H) Epithelial (ECAD+) and immune (CD45+) cells were manually counted in BrdU+ clusters. Bars contain ECAD–CD45–BrdU+ (not identified), ECAD+CD45–BrdU+ (epithelial), and ECAD–CD45+BrdU+ (immune) cells superimposed on the total number of proliferating cells per cluster (BrdU+DAPI+). Data are mean ± SEM, n = 3. Representative immunofluorescence of immune cell infiltrates presents in (arrowhead) or bordering (arrow) BrdU+ cell clusters. ECAD (red), CD45 (white), and BrdU (green). Scale bar: 10 μm.

