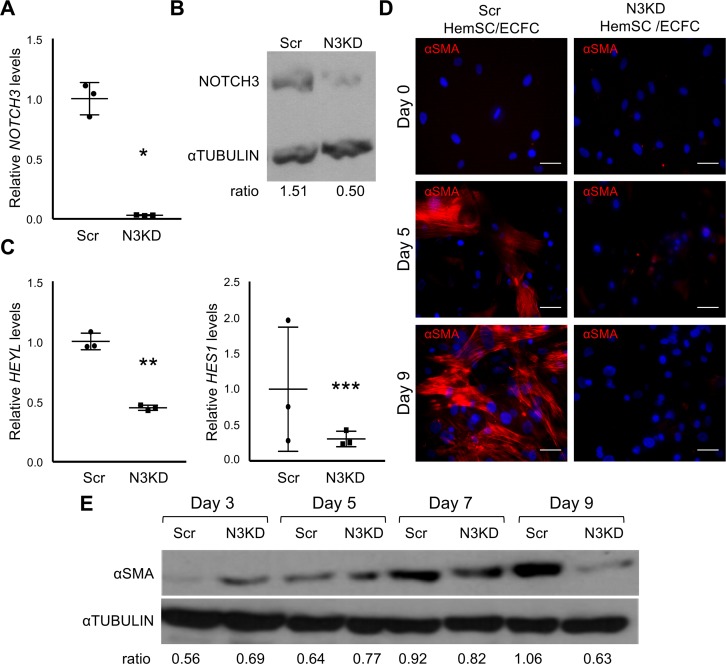
Figure 4. NOTCH3 is necessary for HemSC mural cell differentiation.
(A–C) Assessment of NOTCH3 knockdown (N3KD) in HemSCs. (A) Relative NOTCH3 transcript levels in control HemSCs (Scr), and N3KD HemSCs determined by qRT-PCR and normalized by BACTIN. Representative data from 4 independent N3KD HemSC populations and matching Scr HemSC populations are presented. Error bars represent ± SD. *P < 0.007, Student’s t test. (B) Representative data of Western analysis from 2 independent N3KD and matching Scr HemSC lysates probed with antibodies against NOTCH3 or α-tubulin as a loading control. (C) Relative HEYL and HES1 transcript levels in Scr and N3KD HemSCs determined by qRT-PCR and normalized by BACTIN expression. Representative data presented from 3 independent HemSC populations done in duplicate. Error bars represent ± SD. **P < 0.0007, ***P < 0.05, Student’s t test. (D) Scr HemSCs (n = 3) or N3KD HemSCs (n = 3) cocultured with ECFCs in growth media were stained for αSMA at days 0, 5, and 9. Scale bars: 50 μm. (E) Day 3, 5, 7, and 9 lysates from Scr and N3KD HemSC/ECFC cocultures were subjected to Western analysis, and probed with antibodies against αSMA or α-tubulin as a loading control. Ratio of αSMA band intensity normalized by α-tubulin band intensity presented below. Representative data from 3 Scr and N3KD HemSC populations and experiments perform in duplicate for each HemSC population. αSMA, α smooth muscle actin; ECFC, endothelial colony-forming cell; HemSC, hemangioma stem cell; Scr, scrambled.

