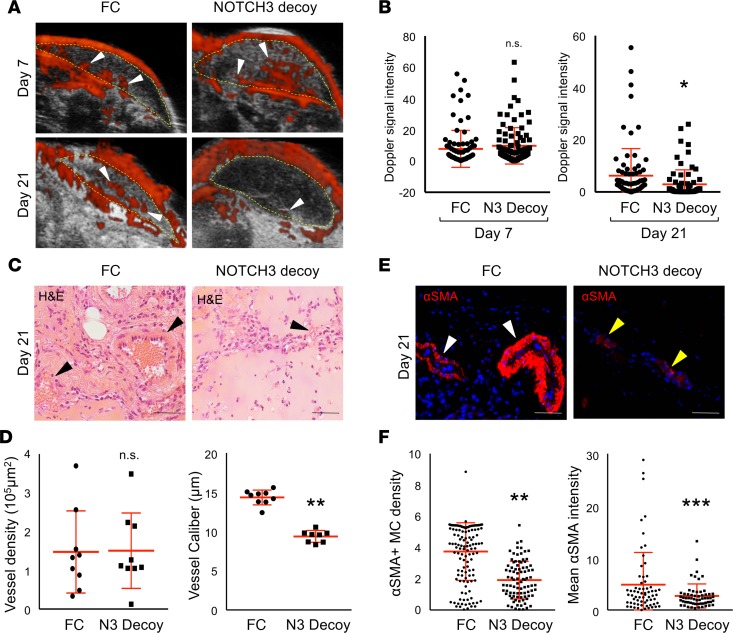
Figure 6. A NOTCH3 inhibitor, NOTCH3 Decoy, blocks IH development and mural cell differentiation.
HemSCs and ECFCs in a 1:1 ratio were resuspended in Matrigel and implanted subcutaneously into immunocompromised mice. An adenovirus encoding NOTCH3 Decoy (N3 Decoy) or FC (control) was administered at either day 3 (H43, data not shown) or day 7 (H49) after implantation and IH development assessed until day 21 (schematic in Supplemental Figure 10A). (A) Detection of high blood flow by ultrasound Doppler of HemSC/ECFC xenografts prior to (day 7) and after (day 21) N3 Decoy and FC adenovirus injection. Xenograft area marked with yellow dotted line. White arrowheads mark Dopplerable blood flow (red). (B) Quantification of Doppler signal intensity normalized to implant area on day 7 and 21 (n = 2 populations; n = 4 implants each). *P < 0.05, Student’s t test. (C) H&E staining of N3 Decoy– and FC-treated xenograft sections. Arrowheads mark red blood cell–containing vessels. (D) Quantification of vessel density and caliber (n = 2 populations; n = 4 implants each). **P < 0.0005, Student’s t test. (E) N3 Decoy and FC HemSC/ECFC xenograft sections stained for αSMA. White arrowheads mark vessel surrounded by αSMA+ mural cells. Yellow arrowheads mark vessel surrounded by mural cells that express low levels of αSMA. (F) αSMA+ mural cell density determined as mean mural cell αSMA signal intensity normalized to IH endothelial GLUT1 signal intensity. Average mural cell αSMA expression determined as mean αSMA signal intensity–normalized DAPI+αSMA+ cell number (n = 2 populations; n = 4 implants each). n.s., not significant. **P < 0.0005, ***P < 0.01, Student’s t test. Scale bars: 50 μm. αSMA, α smooth muscle actin; ECFC, endothelial colony-forming cell; GLUT1, glucose transporter 1; HemSC, hemangioma stem cell; IH, infantile hemangioma, MC, mural cell; N3 Decoy; NOTCH3 Decoy; Scr, scrambled.

