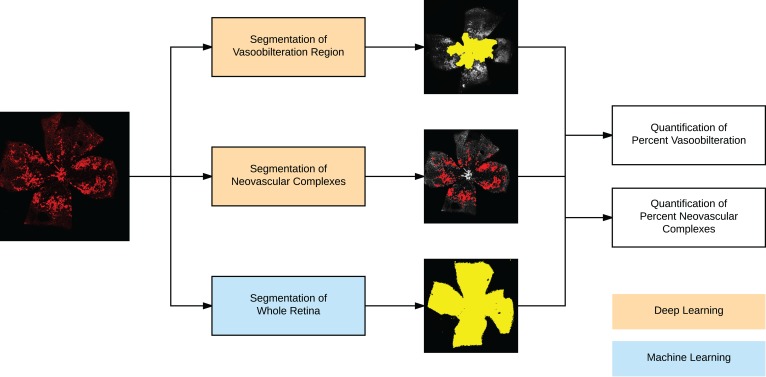
Figure 1. Overview of the fully automated analysis pipeline for oxygen-induced retinopathy images.
The input image is fed through 3 separate fully automated methods: Segmentation of the vaso-obliteration region using deep learning, segmentation of the neovascular complexes using deep learning, and segmentation of the whole retina. These are combined to calculate quantitative ratios of the percentage of vaso-obliteration and percentage of neovascular complexes.

