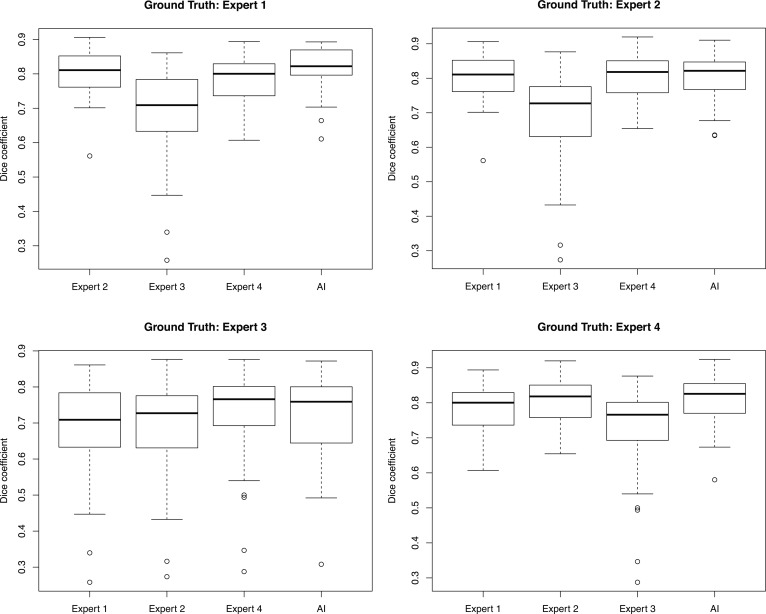
Figure 4. Inter-rater reliability with 4 human expert segmentations compared with deep learning for vaso-obliteration region.
Inter-rater reliability with 37 images segmented by 4 human experts and the deep learning model for vaso-obliteration segmentation. Each set of box plots represents a different human expert set as ground truth compared against the other 3 human experts and the deep learning model using Dice coefficients. The middle bar represents the median, the box represents the interquartile range, and the whiskers extend to the most extreme data point, which is no more than 1.5 times the interquartile range from the box.

