
Figure 2. Glucose tolerance and insulin tolerance test results.
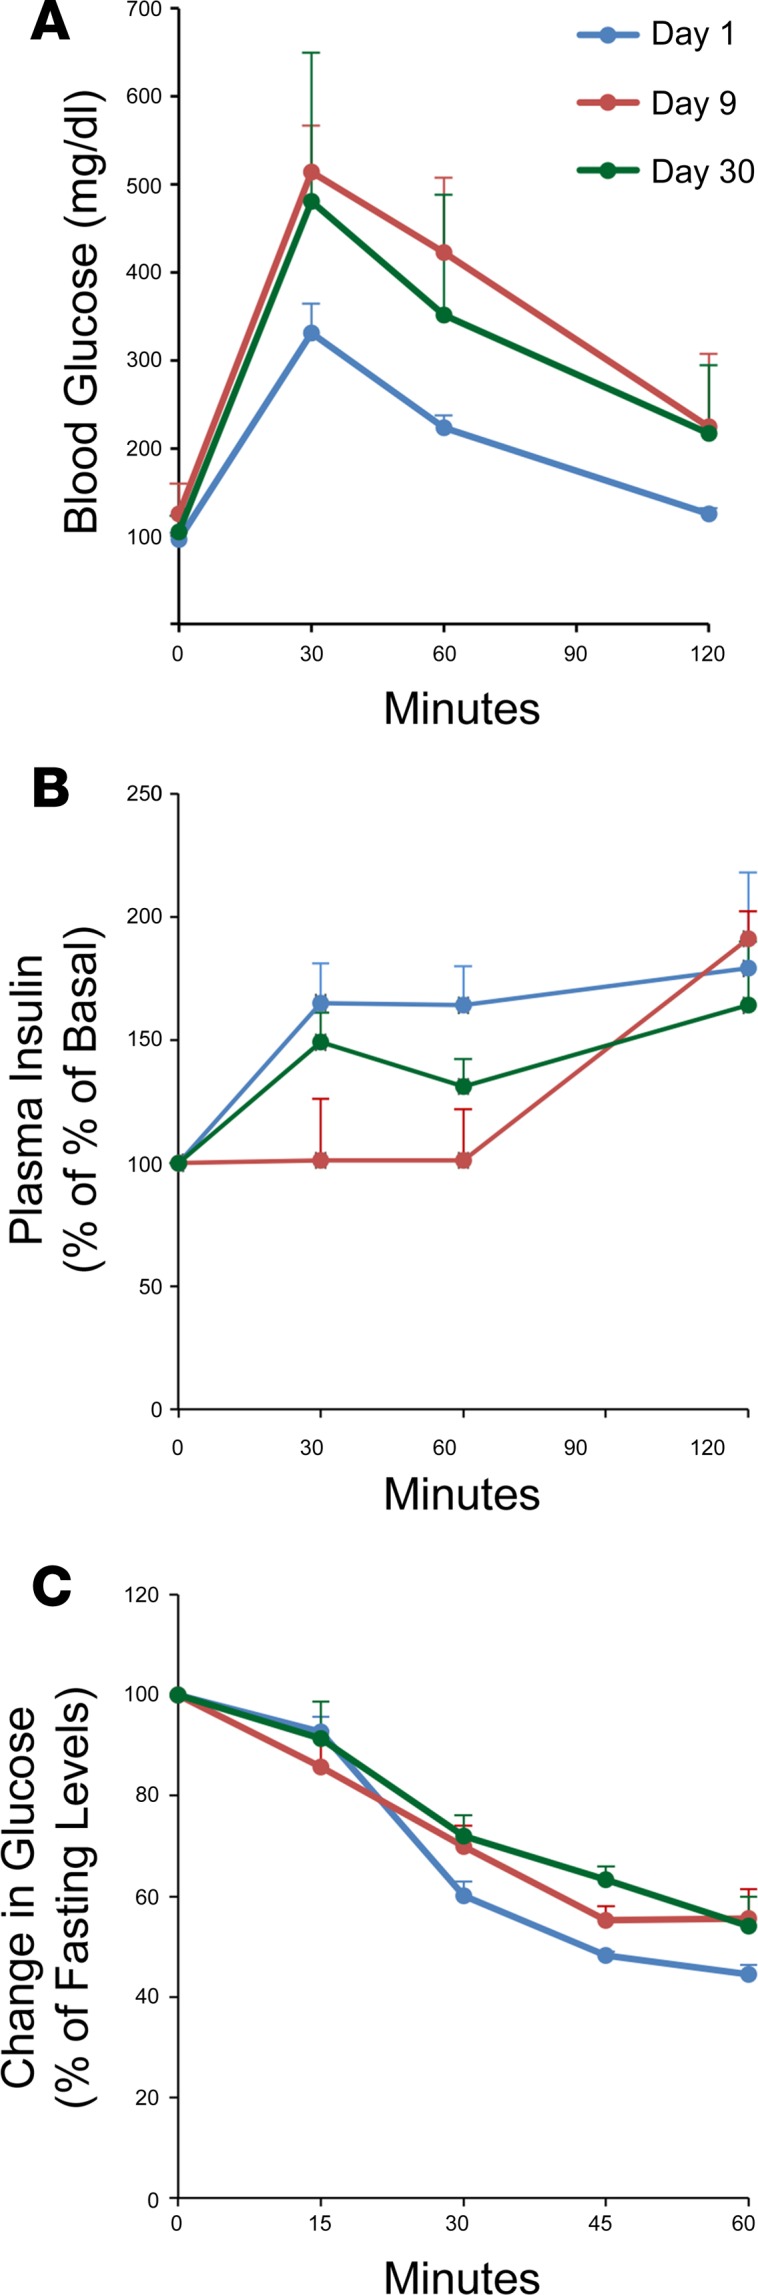
Blue line indicates controls on regular chow; green line indicates high-fat diet (HFD) for 9 days; orange line indicates HFD for 9 days and then reversal to regular chow for 21 more days. (A and B) Glucose tolerance test (i.p., 120 minutes). (A) Glucose tolerance (i.p.) in both 9-day HFD groups (green and orange lines) deteriorated despite reversal of 1 HFD group to regular chow on day 9 through day 30. (B) Insulin levels during IPGTT were not different, although the HFD group that was reversed from HFD had a delay in developing insulin increments. (C) Insulin tolerance test (60 minutes). Glucose fell to similar levels during ITT on baseline regular diet and on a HFD, despite reversal of 1 HFD group to regular chow on day 9 through day 30. Consequently, no differences in insulin sensitivity were observed.