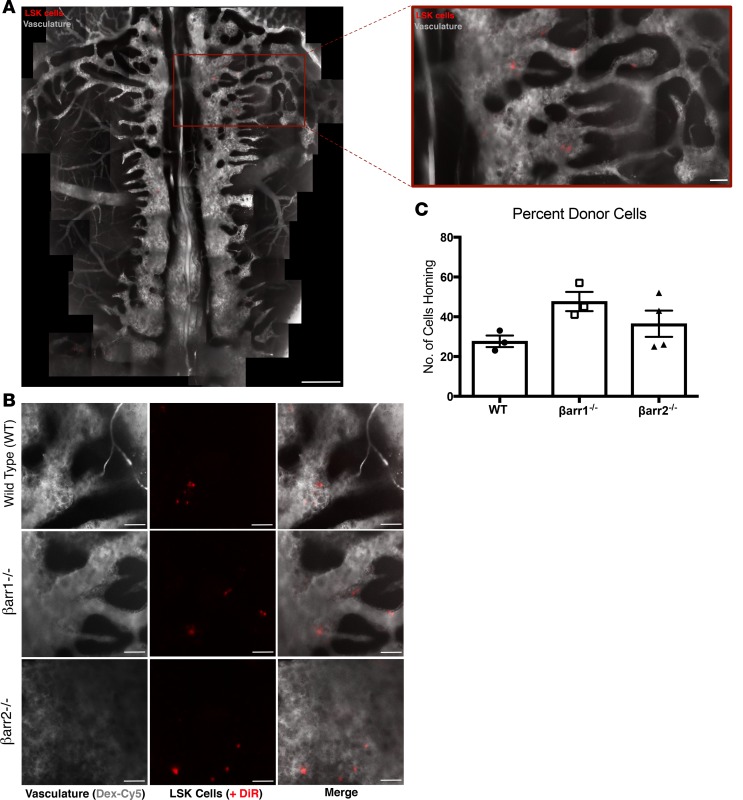
Figure 2. Donor KLS cells from WT, β-arrestin1–knockout, and β-arrestin2–knockout mice home to marrow.
(A) Montage image and zoom of mouse calvarium engrafted with DiR+ cells (gray = bone marrow vasculature, Dex-Cy5; red = DiR+ cells). Scale bars: calvarium: 400 μm; zoom image: 75 μm. (B) Representative images of WT, βarr1–/–, and βarr2–/– cells homing to calvarial bone marrow. In vivo imaging performed +20 hours after engraftment. Representative images of n = 3 experiments. Scale bars: 75 μm. (C) Cell homing count for WT, βarr1–/–, and βarr2–/– cells (mean ± SEM; n = 3). βarr1–/–, β-arrestin1 knockout; βarr2–/–, β-arrestin2 knockout.

