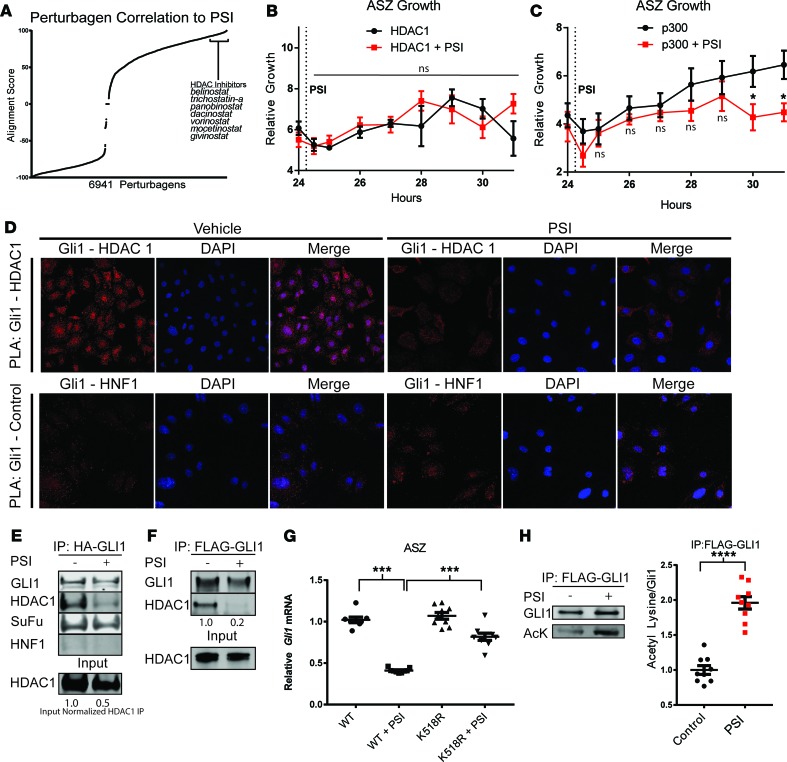
Figure 2. aPKC promotes HDAC1 recruitment and deacetylation of GLI1.
(A) Comparison of LINCS data and PSI RNA-sequencing data demonstrates a strong overlap in expression fold change between aPKC inhibitor (PSI) and HDAC inhibitors. ASZ cells were transfected with (B) HDAC1 (n = 3; 2-way ANOVA) or (C) p300 (n = 3, 2-way ANOVA), and continuous cell growth was measured using Real-Time Glo reagent. The indicated cells were treated with PSI (2.5 μM) after 24 hours, as indicated by the dotted line. (D) Proximity ligation assay between GLI1-HDAC1 and GLI1-HNF1 (control) in ASZ cells (original magnification, ×64 confocal images). Immunoprecipitation of epitope-tagged GLI1 overexpressed in HEK 293T cells (E) and ASZ cells (F), probing for epitope (HA or FLAG), HDAC1, SuFu, and HNF1. Input normalized HDAC1 IP = HDAC1 IP/HDAC1 input (E). (G) Gli1 mRNA measured by qPCR 24 hours after transfection and serum withdrawal in ASZ cells, normalized against GAPDH. WT cells versus K518R-expressing cells treated with PSI (n = 3, ANOVA). (H) GLI1 acetylation assayed by immunoprecipitation of FLAG-GLI1, followed by acetyl lysine and GLI1 immunoblot in ASZ cells (n = 9, Student’s t test). All control measurements are black, while PSI treatment measurements are red. Error bars represent SEM. AcK, acetylated lysine antibody. *P < 0.05, ***P < 0.001, ****P < 0.0001.

