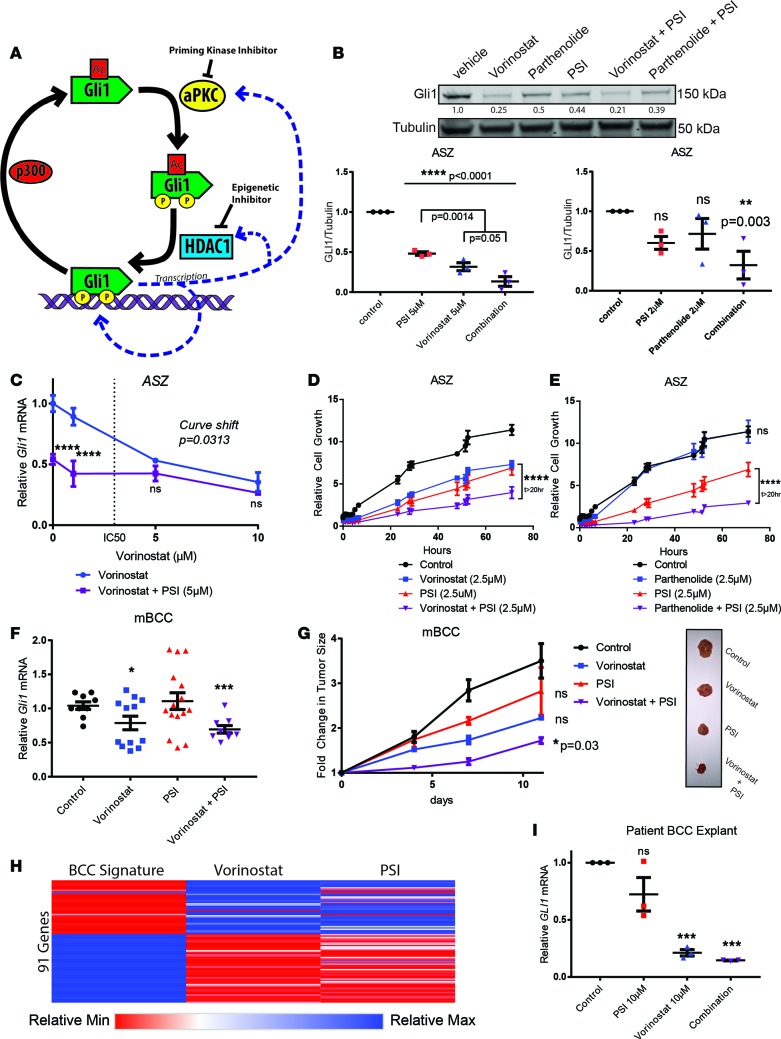
Figure 3. aPKC inhibition complements HDAC inhibition in vitro and in vivo.
(A) Schematic of combination therapy rationale. (B) Western blot of Gli1 from ASZ cells, following drug treatment and serum withdrawal. Replicates are quantified after normalization against tubulin (n = 3). Additional P values (ANOVA) provided for vorinostat versus combination therapy quantify differences. (C) qRT-PCR of Gli1 mRNA normalized to HPRT1 in ASZ cells following drug treatment (n = 3; 2-way ANOVA and linear regression). (D and E) ASZ cell growth following drug treatment, as measured by Real-Time Glo reagent (n = 3; 2-way ANOVA). (F) qRT-PCR of Gli1 mRNA from mouse BCC (n = 4; ANOVA). (G) Tumors size following drug treatment and representative images (n = 4; ANOVA). (H) Changes to BCC signature genes (Supplemental Table 2) in mouse BCC allografts following vorinostat (n = 2) or PSI (n = 1) treatment compared with control (n = 2). Relative values illustrated as a range from blue (upregulated) to red (downregulated). (I) qRT-PCR of Gli1 mRNA normalized to HPRT1 from patient-derived BCC explants (n = 3, technical replicates). All control measurements are black, HDAC inhibitor treatment measurements are blue, PSI treatment measurements are red, and combination PSI plus HDAC inhibitor treatment measurements are purple. Error bars represent SEM. *P < 0.05, **P < 0.01, ***P < 0.001, ****P < 0.0001.

