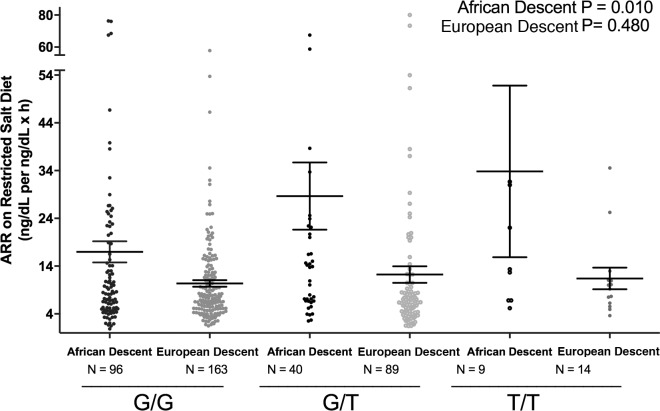
Figure 6. Comparison on aldosterone/renin ratio by endothelin-1 genotype in European descent subjects and African descent subjects.
The trend analyses were adjusted for age, sex, BMI, site, disease state, serum cortisol, 24-hour urine potassium, and plasma renin activity. Data are represented in a dot plot with the mean ± SEM. The subjects were from the restricted HyperPATH subcohort (ARR, aldosterone/renin ratio).

