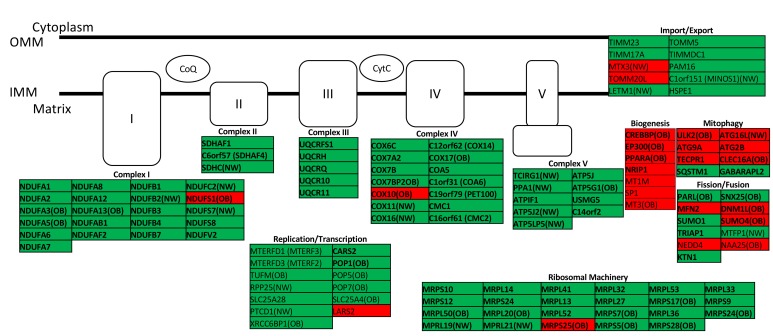
Figure 6. Mitochondrial gene expression vs.
maternal free fatty acids in the second trimester in uMSC adipocytes. Green, upregulated; red, downregulated; all P < 0.05; bold, FDR < 0.25 in targeted gene set analysis. Differential expression in obese (OB, n = 7) or normal weight (NW, n = 7) cohorts designated where applicable. Analysis was performed using linear regression. OMM, outer mitochondrial membrane; IMM, inner mitochondrial membrane; CoQ, coenzyme Q; CytC, cytochrome C)

