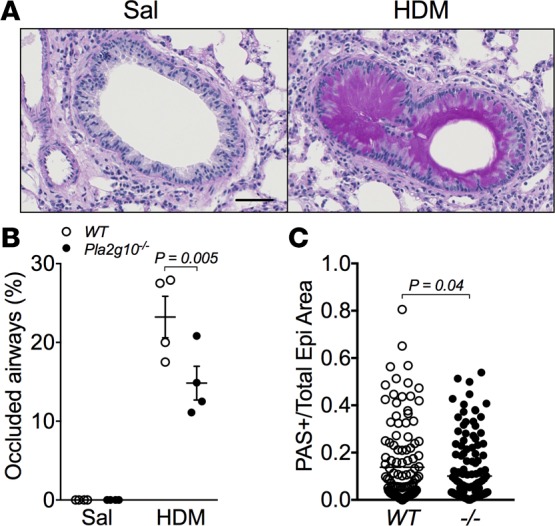
Figure 5. Epithelial mucus production in HDM-exposed Pla2g10–/– mice is dampened compared with WT mice.

(A) Representative images of PAS staining from a WT mouse exposed to saline or HDM. Original magnification, 20x; scale bar: 50 μm. (B) Percentage of occluded airways in saline- and HDM-exposed mice, quantified based on the extent of PAS-positive staining in the airway lumen (n = 3/group for Sal and 4/group for HDM). Mean ± SEM, 2-way ANOVA with uncorrected Fisher’s LSD. (C) Individual airways were assessed to determine the ratio of epithelial area that stained positive for PAS to the total epithelial area as determined by Visiopharm analysis in HDM-exposed WT and Pla2g10–/– mice (–/–, Pla2g10–/–; n = 122 airways for WT and 149 airways for –/–). Mean ± SEM, unpaired t test.
