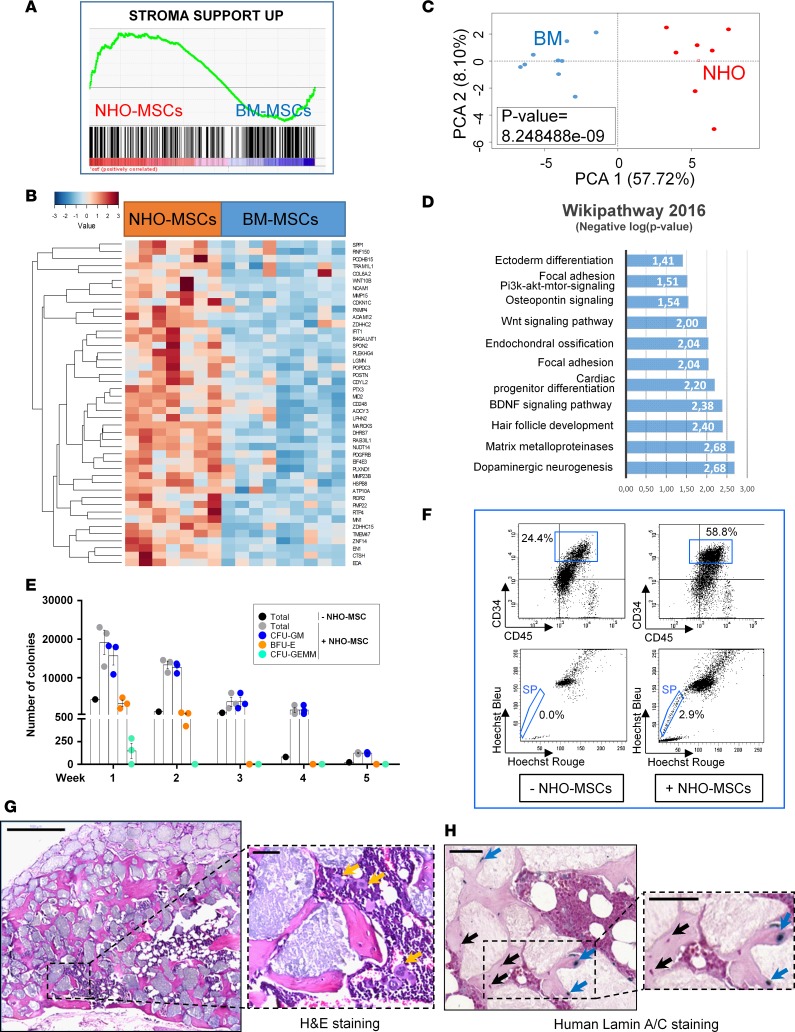
Figure 3. Human NHO-MSCs support in vitro and in vivo hematopoiesis.
(A) Transcriptome gene set enrichment analysis performed with the Charbord et al. expression profile (46) was compatible with a hematopoietic niche support and applied to the expression differential between neurogenic heterotopic ossification (NHO; n = 7) and bone marrow (BM; n = 9) mesenchymal stromal cells (MSCs). (B) Heatmap representing hematopoiesis-supporting genes upregulated in NHO-MSCs versus BM-MSCs; each column represents the transcriptome of MSCs from individual patients (NHO-MSCs) or healthy donor controls (BM-MSCs). (C) Unsupervised principal component analysis performed with genes supporting hematopoiesis discriminated NHO-MSCs from BM-MSCs (P value calculated by correlation of the group variable to the first principal axis). (D) Bar plot representing functional enrichment analysis (WikiPathway database) showing hematopoiesis supporting genes overexpressed in NHO-MSCs (bars represent negative logarithm base 10 of the enrichment P value). (E) Number of colonies formed from human BM hematopoietic cells cocultured with NHO-MSCs (n = 3) for 5 weeks. Results are expressed as the mean number of colonies for the total number of cells obtained after each weeks of culture ± SEM. (F) Identification of CD45+CD34+ side population (SP) cells obtained after a 4-day coculture of lineage-negative cells from peripheral blood with or without human NHO-MSCs. (G) Scaffolds with human NHO-MSCs implanted into nude mice (H&E). Representative section 10 weeks after implantation in mice (n ≥ 4); yellow arrows indicate the presence of megakaryocytes. Scale bar: 500 μm (left); 50 μm (right). (H) Specific human lamin A/C staining; blue arrows indicate human osteocytes positive for lamin A/C, and black arrows indicate murine cells. Scale bar: 50 μm.

