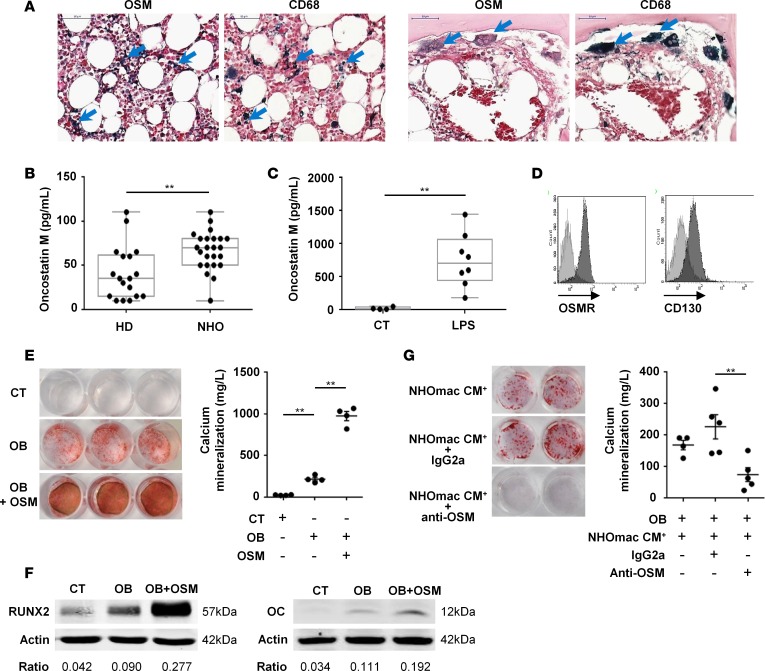
Figure 7. Macrophage-derived OSM is involved in human NHO formation.
(A) CD68 and oncostatin M (OSM) staining on neurogenic heterotopic ossification (NHO) serial sections. Blue arrows indicate OSM or CD68 dark blue staining. Scale bar: 50 μm. (B) OSM concentrations measured by ELISA in blood plasma from healthy donors (HD) or NHO patients. Each dot represents a different donor/patient, and the box-and-whisker plot shows median, 25th and 75th percentile, minimum and maximum values (n = 18–24; **P ≤ 0.01, nonparametric Mann-Whitney test). (C) NHO CD14+ monocytes/macrophages cultured with or without LPS (100 ng/ml) for 3 days. OSM concentrations were measured in control (CT) or LPS-stimulated conditioned medium (LPS). Each dot is from a different donor (n = 4–8; **P ≤ 0.01, nonparametric Mann-Whitney test). (D) Expression of OSM receptor (OSMR) and CD130 (gp130) on NHO muscle–derived stromal cells (NHO-MDSCs) by flow cytometry. Light gray curves represent isotype-matched control antibodies. (E) NHO-MDSCs were cultured in control medium (CT) or osteogenic medium alone (OB) or supplemented with OSM (100 ng/ml, OB + OSM). Cells were then stained with Alizarin Red S. Calcium mineralization was quantified and expressed as mean ± SEM (n = 4). (F) Western blots show Runx2 and osteocalcin (OC) protein expression in NHO-MDSC lysates stimulated or not with OSM and with (OB) or without (control [CT]) osteoblastic differentiation medium (day 3 and day 21, respectively). (G) Human NHO CD14+ monocytes/macrophages (mac) were cultured with LPS (100 ng/ml) for 3 days and conditioned media (NHOmac CM+) were recovered. NHO-MDSCs were cultured in osteogenic medium supplemented with NHOmac CM+ alone (NHOmac CM+) or in the presence of control IgG2a (NHOmac CM+ + IgG2a) or anti-OSM (NHOmac CM+ + anti-OSM) antibody for 12 days. Cells were then stained with Alizarin Red S. Calcium mineralization was expressed as mean ± SEM (n = 4–5). Ratios correspond to RUNX2/actin or OC/actin. For statistical analysis, 1-way ANOVA followed by Dunnett’s post-hoc test were used (E and G) (**P ≤ 0.01).

