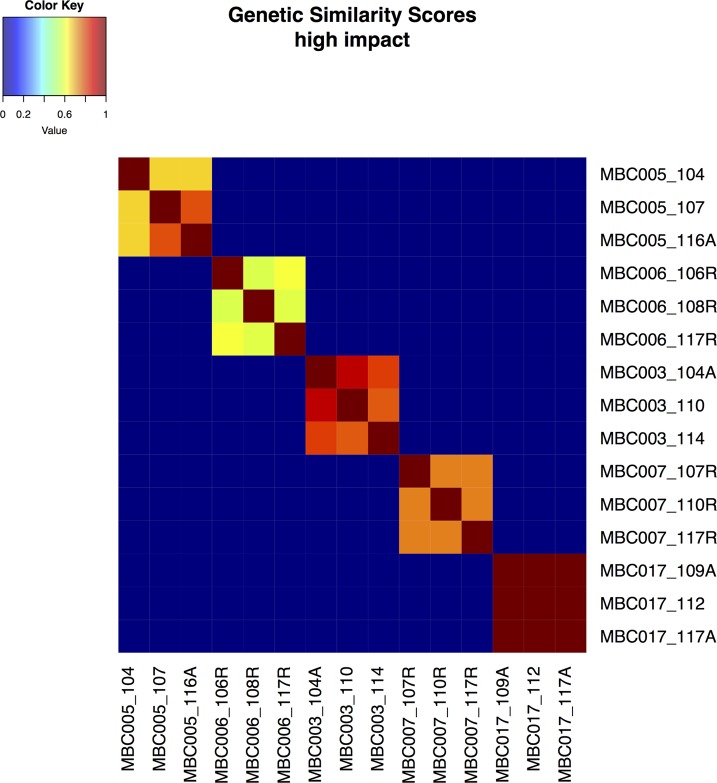
Figure 4. Genetic similarity scores.
Genetic similarity scores were calculated as described for all pairs of samples for high-impact mutations. Similarity among metastases within each patient is generally substantial but varies. Genetic similarity scores range from 0 to 1 and are colored as depicted.

