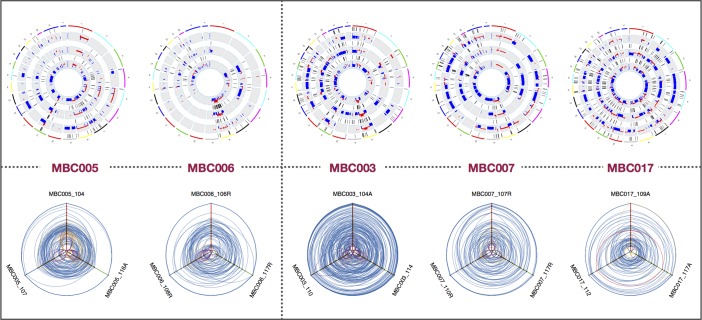
Figure 6. Hive plots, copy number variation, and loss of heterozygosity profiles reveal patient-specific patterns.
Hive plots of allele frequencies for all variants, for each patient, suggest trajectories of variant accumulation and tumor evolution. In each hive plot, the axes represent allele frequency, with 0% at the center and 100% at the periphery. A variant in one metastasis is connected with a line to the appropriate allele frequencies in the other metastases. Variants specific to one metastasis are in purple; yellow denotes variants in 2 metastases. See Supplemental Figure 7 for an overview of hive plots. Also shown are copy number variation (CNV) and loss of heterozygosity (LOH) profiles for 3 metastases for each of the 5 patients. Copy number changes are displayed in red and blue, inside tracks with LOH marked in purple, in concentric rings for related metastases.

