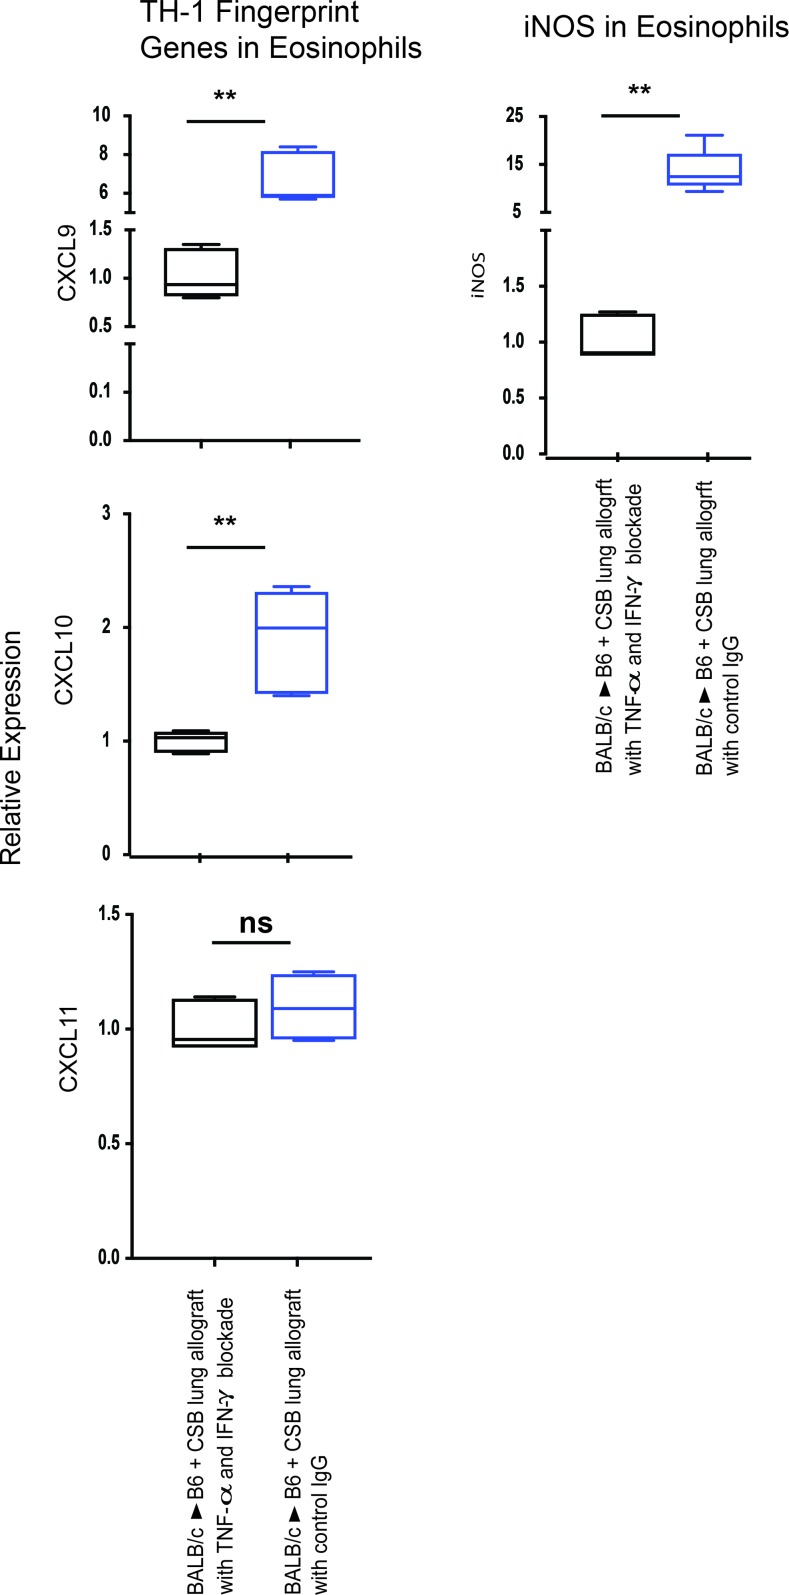
Figure 6. Modulation of Th1 signature genes in lung graft eosinophils.
Expression of Th1 signature genes in lung graft eosinophils after IFN-γ and TNF-α blockade. Blue boxes represent eosinophils isolated from BALB/c→B6 transplanted lung grafts with CSB, and black boxes represent eosinophils isolated from BALB/c→B6 transplanted lung grafts with CSB in the presence of IFN-γ and TNF-α neutralization (representative of a minimum of 4 transplants per group). ns, P > 0.05; **P < 0.01. Comparison by Friedman’s test was used for paired data, while the Kruskal-Wallis test was used for the unpaired group of observations. Post-hoc analysis of differences and comparison of differences between pairs of data were performed with the Wilcoxon rank test and the Mann-Whitney U test for paired and unpaired observations, respectively. For the box plots, the bottom and top of the boxes represent the lower and upper quartiles, respectively; the dark band inside the box represents the median; and the top and bottom whiskers represent the maximum and minimum observed values, respectively.

