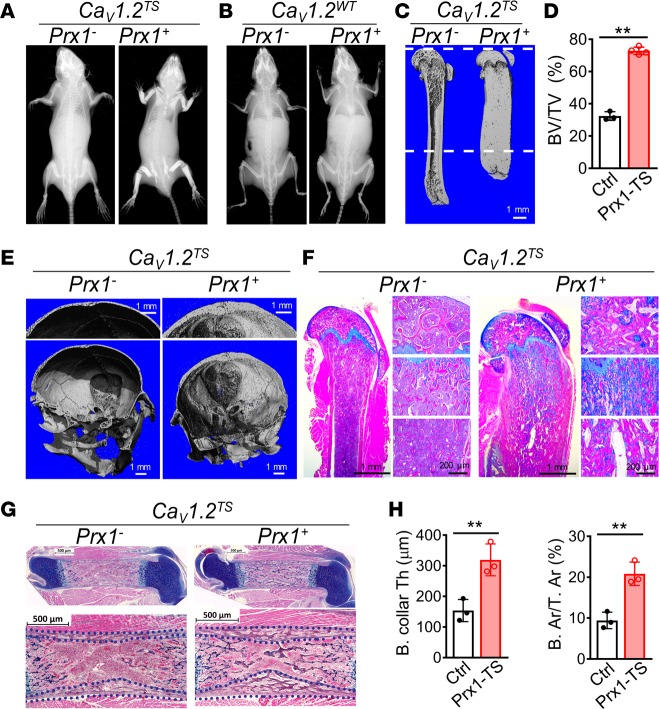
Figure 2. Expression of the CaV1.2TS channel increases bone mass in vivo.
(A and B) Radiographs of the whole bodies of 6-week-old Cre–;CaV1.2TS (control) and Prx1-Cre;CaV1.2TS (mutant) littermate mice. (C) μCT 3-D reconstruction images of the femurs of 6-week-old Cre–;CaV1.2TS (control, Prx1-) and Prx1-Cre;CaV1.2TS (mutant, Prx1+) littermate mice. (D) μCT analysis of BV/TV obtained from 800 slices (10-μm thick; 8 mm total) from the distal femur, a region indicated by the dashed lines in C. Bar values are means ± SD (n ≥ 3, **P < 0.01). (E) μCT 3-D reconstruction images of skulls of 6-week-old Cre–;CaV1.2TS and Prx1-Cre;CaV1.2TS littermate mice. (F) Alcian blue Hematoxylin/Orange G (ABH/OG) staining of longitudinal femur sections from 6-week-old Cre–;CaV1.2TS and Prx1-Cre;CaV1.2TS littermate mice at 1.25× magnification. Shown to the right of the main images are 10× magnifications of the secondary ossification center (top), primary spongiosa (middle), and marrow region (bottom). (G) ABH/OG staining of longitudinal femur sections from Cre–;CaV1.2TS and Prx1-Cre;CaV1.2TS littermate mice at P0. (H) Analysis of bone collar thickness (B. collar Th) and percentage of bone area over tissue area (B. Ar/T. Ar) of femur diaphysis from Cre–;CaV1.2TS and Prx1-Cre;CaV1.2TS littermate mice at P0. Bar values are means ± SD (n = 3. **P < 0.01). Statistical analysis was performed by 2-tailed unpaired t test.

