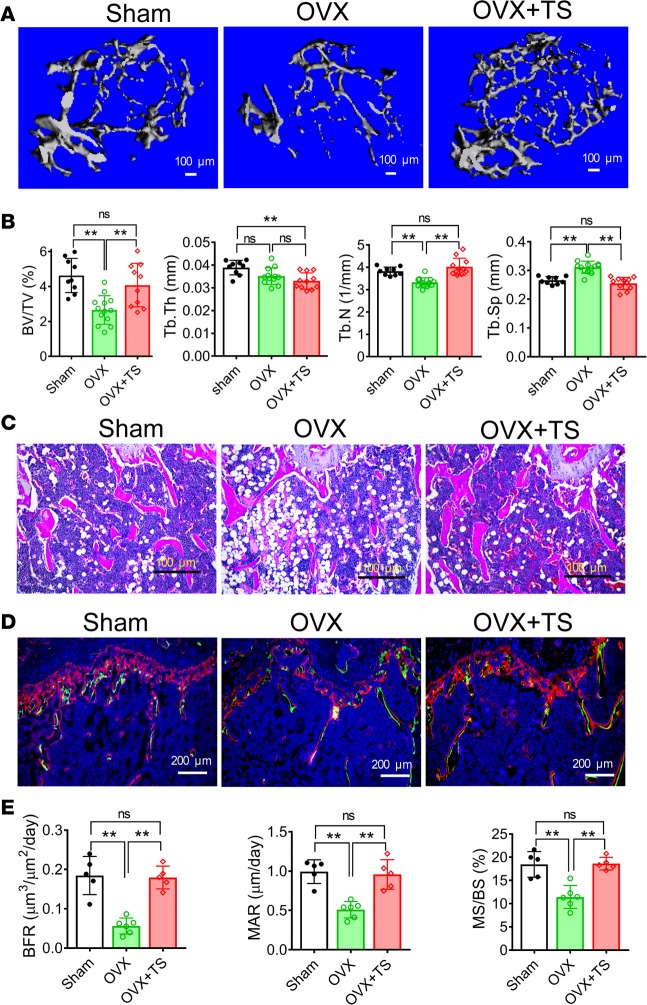
Figure 5. CaV1.2TS prevents estrogen deficiency–induced bone loss.
(A) μCT 3-D reconstruction images of metaphyses of distal femurs of mice 8 weeks after sham surgery, ovariectomy [OVX], and OVX with CaV1.2TS expression (Sp7-Cre;CaV1.2TS). (B) Analysis of bone volume density (BV/TV), trabecular thickness (Tb.Th), trabecular number (Tb.N), and trabecular spacing (Tb.Sp) of metaphyses of distal femurs of mice 8 weeks after sham surgery, OVX, or OVX with CaV1.2TS expression (Sp7-Cre+;CaV1.2TS). Bar values are means ± SD (n ≥ 8. **P < 0.01). (C) H&E staining of mice 8 weeks after sham surgery, OVX, or OVX with CaV1.2TS expression (Sp7-Cre;CaV1.2TS). (D) Representative images of calcein and alizarin red double labeling in the trabecular bones underneath the growth plate of mice 8 weeks after sham surgery, OVX, or OVX with CaV1.2TS expression (Sp7-Cre;CaV1.2TS). (E) Dynamic histomorphometry analysis of trabecular bones 1.5 mm away from the growth plate of mice 8 weeks after sham surgery, OVX, or OVX with CaV1.2TS expression (Sp7-Cre;CaV1.2TS). BFR, bone formation rate; MAR, mineral apposite rate; and MS/BS, percentage of mineralizing surface over bone surface. Bar values are means ± SD (n ≥ 8. *P < 0.05 and **P < 0.01). Statistical analysis was performed by one-way ANOVA followed by Tukey’s post-test analysis, and a P value less than 0.05 was considered significant.

