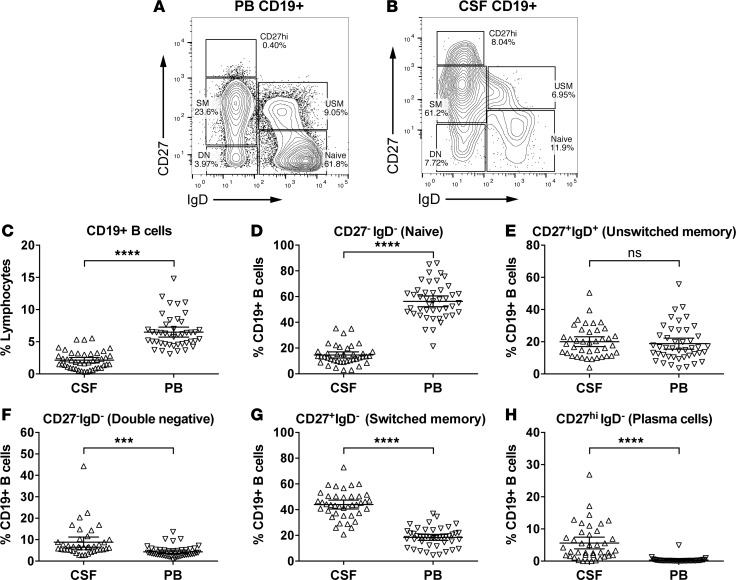
Figure 2. B cell subsets in CSF and PB.
Shown are representative FACS plots of peripheral blood (PB) (A) and cerebrospinal fluid (CSF) (B) CD19+ B cell subsets (patient 56414), as defined based on the expression of IgD and CD27. The graphs in C–H summarize data from all patients, i.e., both Gd+ and Gd– patients combined, to provide an overall picture of B cell subset distribution in both compartments. CD19+ B cells are approximately 3-fold lower in CSF (C, 6.7% ± 2.6% in PB versus 2.25% ± 1.4% in CSF). The CSF contains B cell subpopulations predominantly that have undergone somatic rearrangement of their B cell receptors (F–H). Among CD19+ B cells, in CSF compared with PB, naive are approximately 5-fold lower (D, 56.8% ± 14.2% in PB versus 11.5% ± 7.6% in CSF); USM are slightly increased (E, 19.1% ± 11.7% in PB versus 22.8% ± 10.4% in CSF); DN are increased (F, 4.0% ± 2.5% in PB versus 7.7% ± 7.3% in CSF); and SM are increased 2.5-fold (G, 18% ± 7.5% in PB versus 45.9% ± 11.8% in CSF). Most significantly, the percentage of CD27hi B cells was increased 34-fold in CSF (H, 0.2% ± 0.2% in PB versus 7.6% ± 7.9% in CSF). Refer to Supplemental Table 1 for more information on the patients analyzed. Data are shown as scatter plots with mean ± 95% CI. Comparisons were made using paired t tests; ***P < 0.01, ****P < 0.0001.

