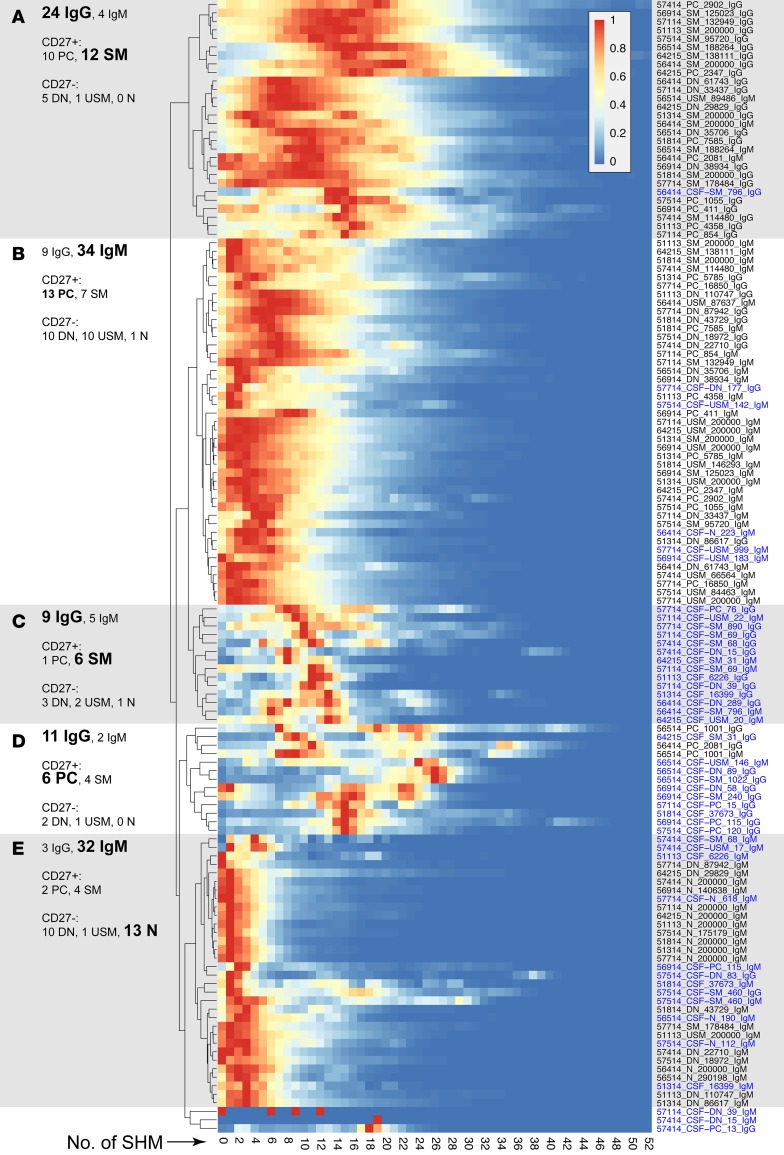
Figure 4. Hierarchical clustering of SHM profiles.
Profiles of SHM along the analyzed IGHV portion of Ig-VH were normalized to the peak (=1, red) and subjected to unsupervised hierarchical clustering. In general, post-GC subsets display higher and naive B cells display lower levels of SHM. (A) Higher level SHM can be found in IgG-expressing SM B cells and PCs. (B) Lower level SHM can be found in IgM-expressing SM B cells and PCs. (C and D) Predominantly IgG-expressing CSF-derived SM B cells and PCs form separate clusters. (E) Lowest level SHM can be found among mostly IgM-expressing naive B cells. Each row represents an individual B cell sample, as indicated by sample names containing patient ID, B cell subset, number of cells analyzed, and Ig isotype separated by “_”. CSF B cells subsets are indicated by “CSF” before the subset designation and blue type. N, naive B cells; USM, unswitched-memory B cells; DN, double-negative B cells; SM, switched-memory B cells; PC, plasma cells/plasmablasts.

