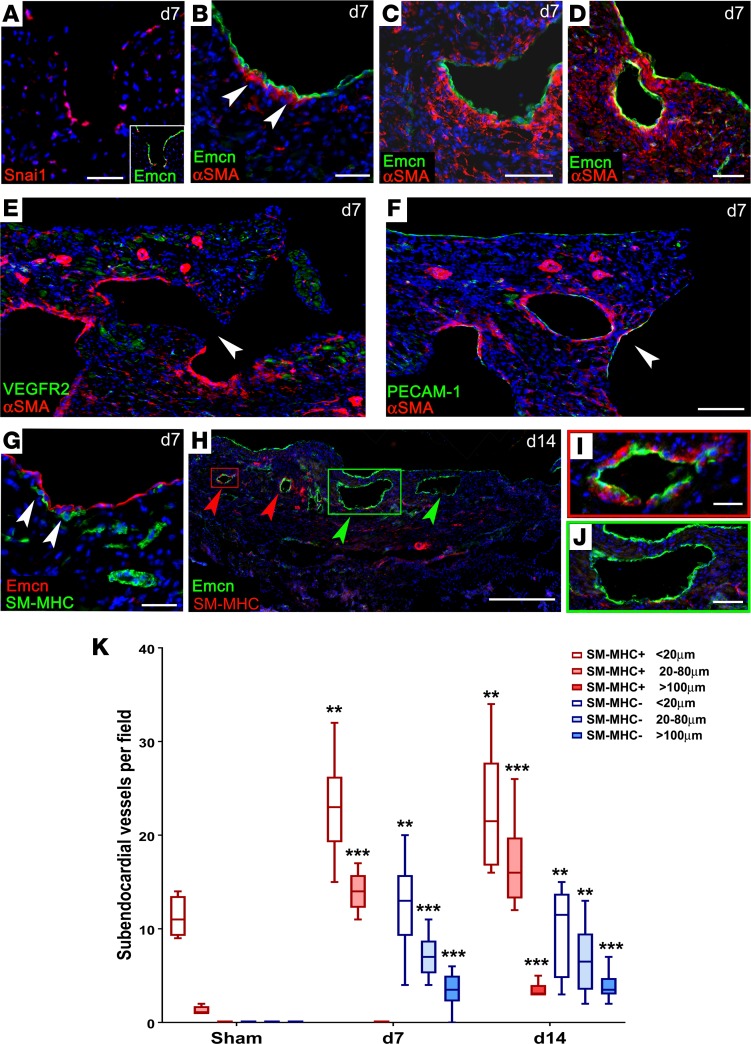
Figure 4. Endocardial remodeling contributes new subendocardial vessels.
Detection of αSMA+ cells by immunostaining suggested either recruitment of smooth muscle precursors or endothelial-to-mesenchymal transition (A–D, arrowheads in B), consistent with expression of Snai1, in endocardial cells (A). Serial sections, approximately 50 μm apart, revealed progressive closure of subendocardial vessels: in (E), the lumen on the endocardial surface was incompletely enclosed (arrowhead) and only the enclosed side had αSMA support, whereas, in a more apical section (F), the equivalent lumen was fully enclosed (arrowhead) and surrounded by αSMA+ mural cells. Later detection of SM-MHC+ cells, from 7–14 days (arrowheads, G), confirmed a mature smooth muscle phenotype (G). By day 14, some subendocardial vessels were fully enclosed by SM-MHC+ cells (red arrowheads, H; enlarged in I), whereas larger vessels remained devoid of VSMC support (green arrowheads, H; enlarged in J). Scale bars: 100 μm (A–D); 500 μm (E, F, and H); 50 μm (G and J); 10 μm (I). An increase in small/medium SM-MHC+ and SM-MHC– vessels was observed by day 7 and an increase in large SM-MHC+ vessels was observed by day 14. Representative of day 7: n = 15 (4 sham); day 14: n = 5 (2 sham). (K) Vessel count number per 3-mm segment, between endocardium and infarct; sham: n = 4; day 7: n = 8; day 14: n = 8. Box-and-whisker plots show mean ± minimum/maximum. 1-way ANOVA with Bonferroni correction; **P ≤ 0.01, ***P ≤ 0.001 versus sham.

