Fig. 2.
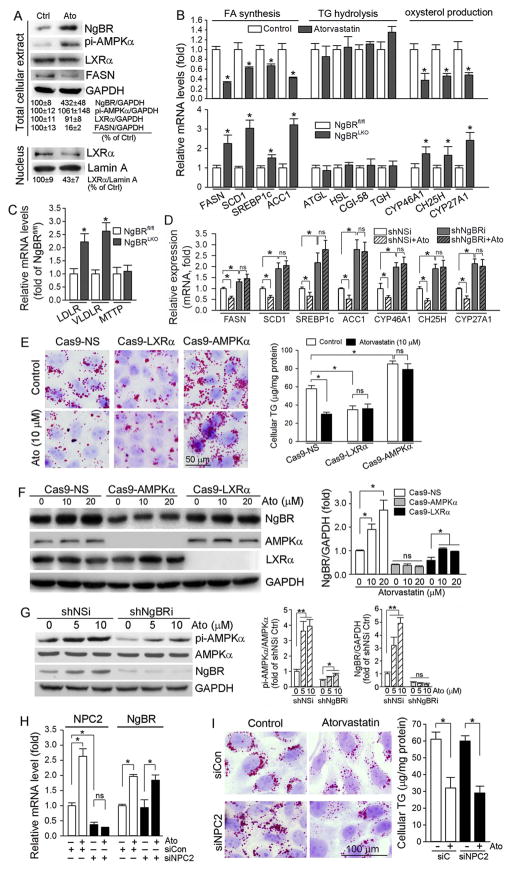
Activation of AMPKα, inactivation of LXRα, and inhibition of oxysetrol producing enzymes are involved in atorvastatin-inhibited hepatic lipogenesis
A: HepG2 cells were treated with atorvastatin (10 μM) for 8 h followed by extraction of total cellular proteins and nuclear proteins, separately. Expression of NgBR, pi-AMPKα, LXRα and FASN in total cellular protein extract, and LXRα in nuclear protein extract was determined by Western blot, respectively; B–D: HepG2 cells (B), shNSi or shNgBRi cells (D) were treated with atorvastatin for 8 h. After treatment, total RNA was extracted from cells. Meanwhile, a piece of liver from NgBRfl/fl or NgBRLKO mice was used to extract total RNA. Expression of mRNA of the genes for lipogenesis (B, D: FASN, SCD1, SREBP1c and ACC1), the genes for TG hydrolysis (B: ATGL, HSL, CGI-58 and TGH), the genes for oxysterol production (B, D: CYP46A1, CH25H and CYP27A1), and the genes for TG-rich lipoprotein metabolism (C: LDLR, VLDLR and MTTP) was determined by real time RT-PCR, respectively; E, F: Cas9-NS, Cas9-AMPKα and Cas9-LXRα cells were treated with atorvastatin at the indicated concentrations for 16. Cellular lipid content was determined by Oil Red O staining and TG quantitative analysis (E). Expression of NgBR, AMPKα and LXRα was determined by Western blot (F); G: shNSi and shNgBRi cells were treated with atorvastatin for 8 h. Expression of AMPKα, pi-AMPKα and NgBR was determined by Western blot; H, I: HepG2 cells in serum-free medium were transfected with scrambled siRNA (siCon) or NPC2 siRNA (siNPC2) for 24 h. Cells were then switched to complete medium and cultured for another 24 h followed by treatment with atorvastatin (10 μM) for 8 h. Expression of NPC2 and NgBR mRNA was determined by real time RT-PCR (H). Cellular lipid content was determined by Oil Red O staining and TG quantitative analysis (I). *: P < 0.05 vs. control or as indicated in the corresponding group; ns: not significantly different. All the experiments were repeated 3 times.

