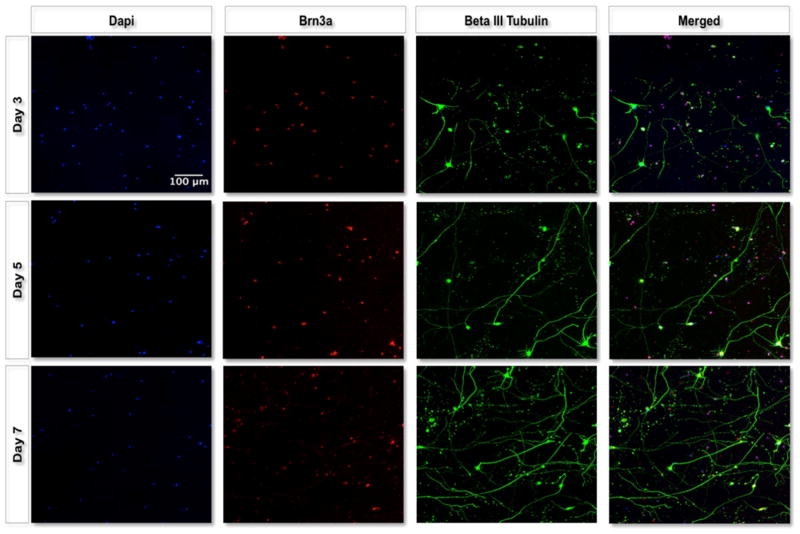
Figure 5.
Maximal intensity projections of representative 3D fluorescent images. 3D images of RGC (red) cultures in 5 wt % PSHU–PNIPAAm–RGD were taken using a confocal microscope after 3, 5, and 7 days in culture. RGCs (red) show long and mostly planar axon extension (green) for the 7 day culture period.

