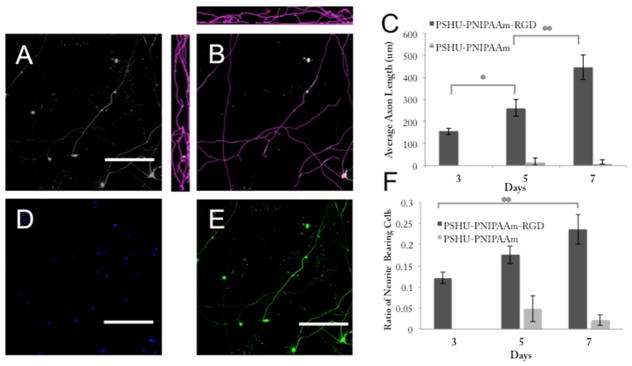
Figure 7.
Average neurite length and ratio of neurite-bearing cells. Quantification of average axon length was performed by analyzing maximal intensity images (A) in all three planes (B) for both PSHU–PNIPAAm–RGD and PSHU–PNIPAAm cultures at 3, 5, and 7 day time points (C). The ratio of neurite-bearing cells (F) was quantified by calculating the number of cells bearing neurites in a visual frame (E) and dividing by the total number of cells within that frame (D). Numbers are plotted for both PSHU–PNIPAAm–RGD and PSHU–PNIPAAm over the 7 day culture period. Statistical significance between groups was determined by ANOVA. *p < 0.05; **p < 0.005. Three images were taken from each of at least three different samples from three separate RGC isolations. The scale bar is 200 μms. Day 5 cultures are shown to provide examples for quantification (A–E).

