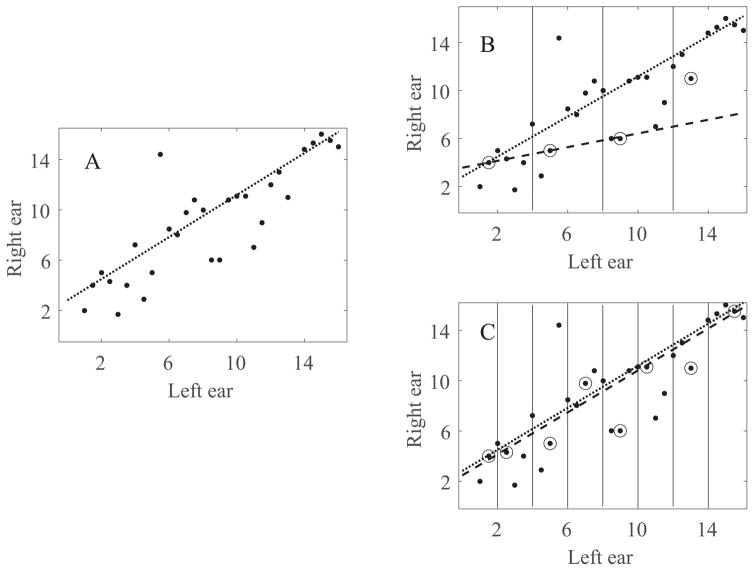
Figure 1.
An example of the procedure used to calculate and analyze reduced data sets. This particular example is derived from I07s data. (A) The full data set of all pitch match samples collected. (B) The reduced data set divided into four equal sections, with one data point randomly sampled from each section. (C) The reduced data set divided into eight equal sections, with one data point randomly sampled from each section. The dotted line indicates the linear fit of the full data set and the dashed line indicates the linear fit of the reduced data set.

