Figure 2.
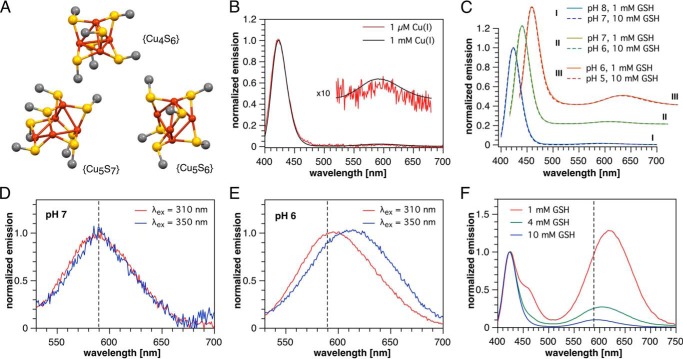
Low-temperature phosphorescence spectra indicating Cu(I)-thiolate clusters. A, structures of the copper-sulfur cores of model Cu(I)-thiolate clusters from literature X-ray crystallographic data. Only copper, sulfur, and carbon directly attached to sulfur are shown for clarity. Cu4S6, [Me4N+]2[Cu4(SMe)6]2−; Cu5S7, [Ph4P+]2[Cu5(SMe)7]2− ·(CH2OH)2; Cu5S6, [Et4N+][Cu5(SCMe3)6]−. B, normalized emission spectra (λex = 310 nm) of 1 μm and 1 mm Cu(I) in the presence of 4 mm GSH in pH 7 PIPES-KCl buffer. C, normalized emission spectra (λex = 310 nm) of 100 μm Cu(I) in the presence of 1 or 10 mm GSH in variable pH universal buffer (see under “Experimental procedures”). D and E, comparison of the long-wavelength region of the emission spectrum (normalized at the respective maxima) at two different pH values and excitation wavelengths (100 μm Cu(I), 1 mm GSH, universal buffer). F, emission spectra of solutions containing 100 μm Cu(I) and 1, 4, or 10 mm GSH at pH 5 (universal buffer, λex = 310 nm, normalized at 423 nm). All phosphorescence spectra were recorded at 77 K using vitrified samples containing 33% propylene glycol.

