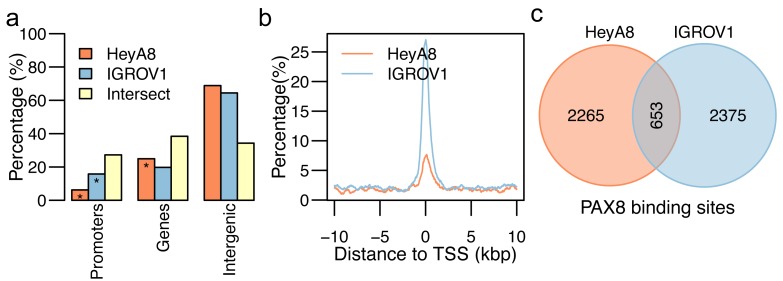
Figure 4. PAX8 ChIP-seq binding sites for HeyA8 and IGROV1.
a. Distribution of PAX8 binding sites across promoter, gene body, superenhancer, and enhancer regions of the human genome for PAX8 binding sites in HeyA8 (orange), IGROV1 (blue), and the intersection of the two sets (yellow). Distribution of the distance of the PAX8 binding sites in HeyA8 (orange) and IGROV1 (blue) with regards to the closest transcription start site (TSS) normalized by the number of PAX8 binding sites in HeyA8 and IGROV1, respectively. Venn diagrams showing the number of (c) PAX8 binding sites in HeyA8 (orange) and IGROV1 (blue).

