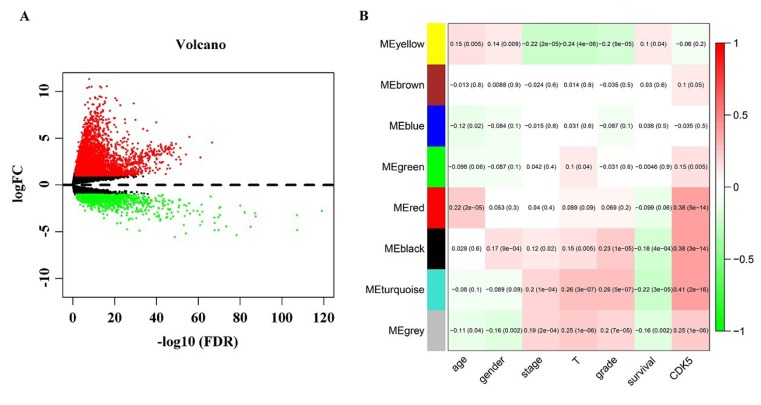
Figure 10. Identification of CDK5-related genes.
(A) Volcano plot of the differentially expressed genes between liver HCC and normal liver tissues. Red indicates high expression, whereas green represents low expression. This volcano plot was generated using the ggplot2 package of R language. (B) Network analysis of differently expressed genes identifies a module of genes co-expressed with CDK5. Each row corresponds to a module eigengene, and each column corresponds to a clinicopathological parameter. Each block contains the corresponding correlation coefficient and P value. The heatmap was drawn using the WGCNA package of R language.

