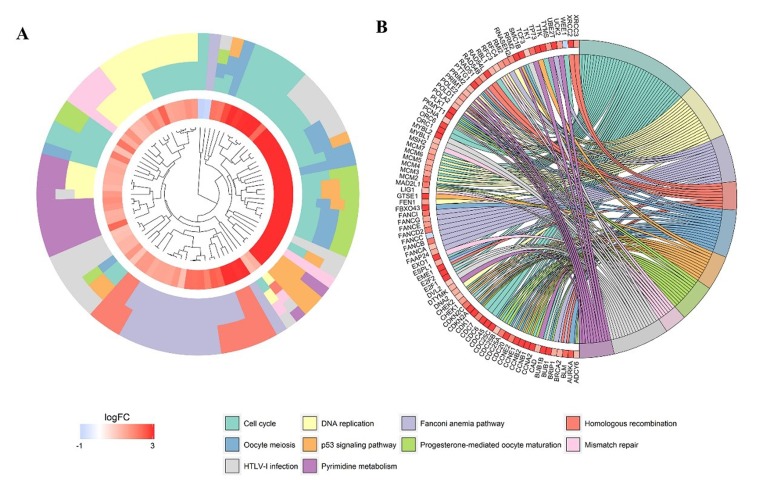
Figure 12. Significantly enriched annotation of the Kyoto Encyclopedia of Genes and Genomes (KEGG) pathway analysis of CDK5-related genes in HCC.
(A) Cluster plot displays a circular dendrogram of the clustering of the expression profiles. The inner ring displays the color-coded logFC, whereas the outer ring indicates the assigned functional KEGG pathways. (B) In the Chord plot, related genes are linked to their enriched KEGG pathways via ribbons. Red coding next to the selected genes indicated up-regulation and blue ones indicated down-regulation.

