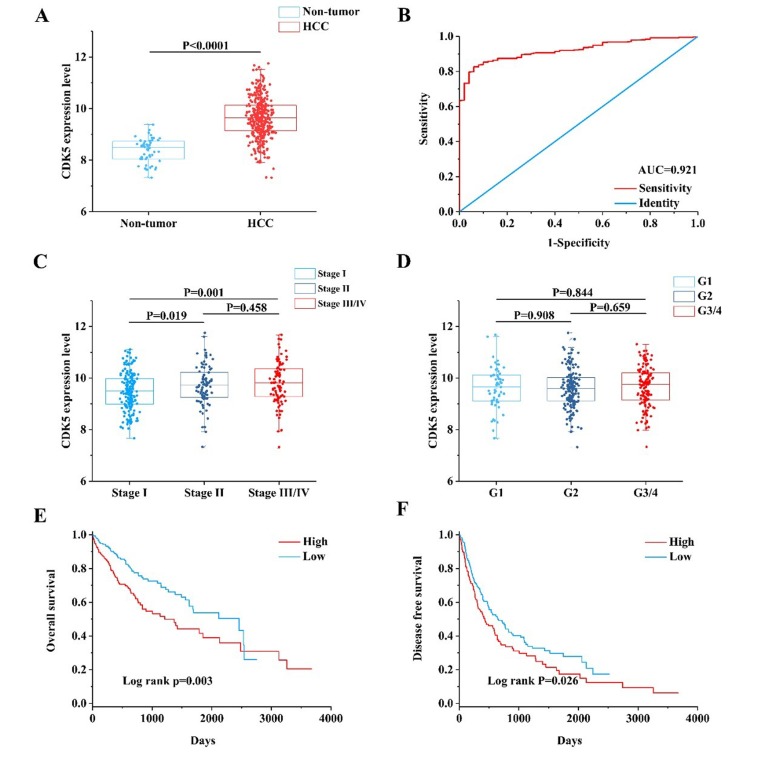
Figure 5. Clinical value of CDK5 in HCC based on TCGA data.
(A) Scatter plot of CDK5 expression in HCC and cancer-free normal liver tissues. (B) Receiver operating characteristic (ROC) curve of CDK5 in HCC. (C) Scatter plot of CDK5 expression at different pathological stages. (D) Scatter plot of CDK5 expression at different histological grades. (E) Kaplan-Meier plots revealed an association between increased CDK5 levels and reduced overall survival. (F) Kaplan-Meier plots revealed an association between increased CDK5 levels and reduced disease-free survival.

