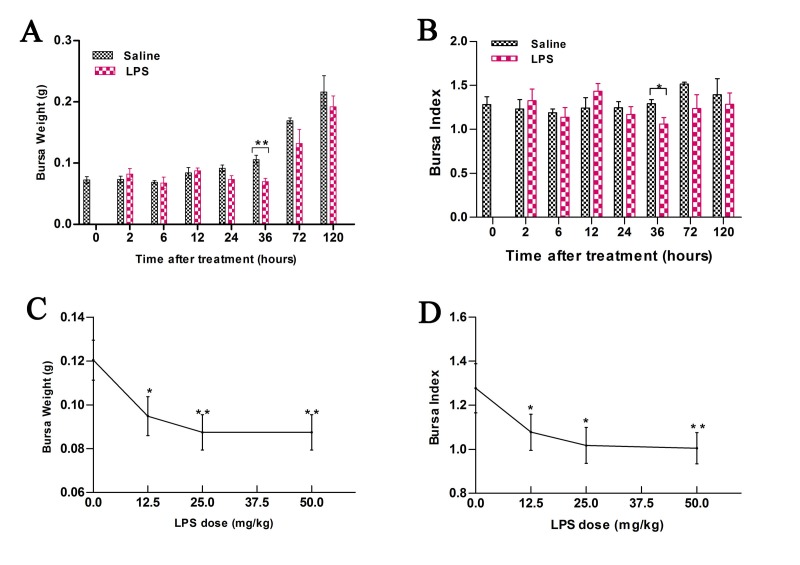
Figure 1. Bursal weight and index in chicks treated with LPS.
A. Comparison of weights of bursa of Fabricius (BF) in chicks at different time points (0-120 h) after treatment with 50 mg/kg LPS or saline. B. Comparison of bursal index in chicks at different time points (0-120 h) after treatment with 50 mg/kg LPS or saline. C. Comparison of weights of bursa of Fabricius (BF) in chicks at 36 h after treatment with different doses of LPS or saline. D. Comparison of bursal index in chicks at 36 h after treatment with different doses of LPS or saline. As shown, LPS induces acute bursal atrophy in chicks. Note: * denotes P < 0.05; ** denotes P < 0.01.

