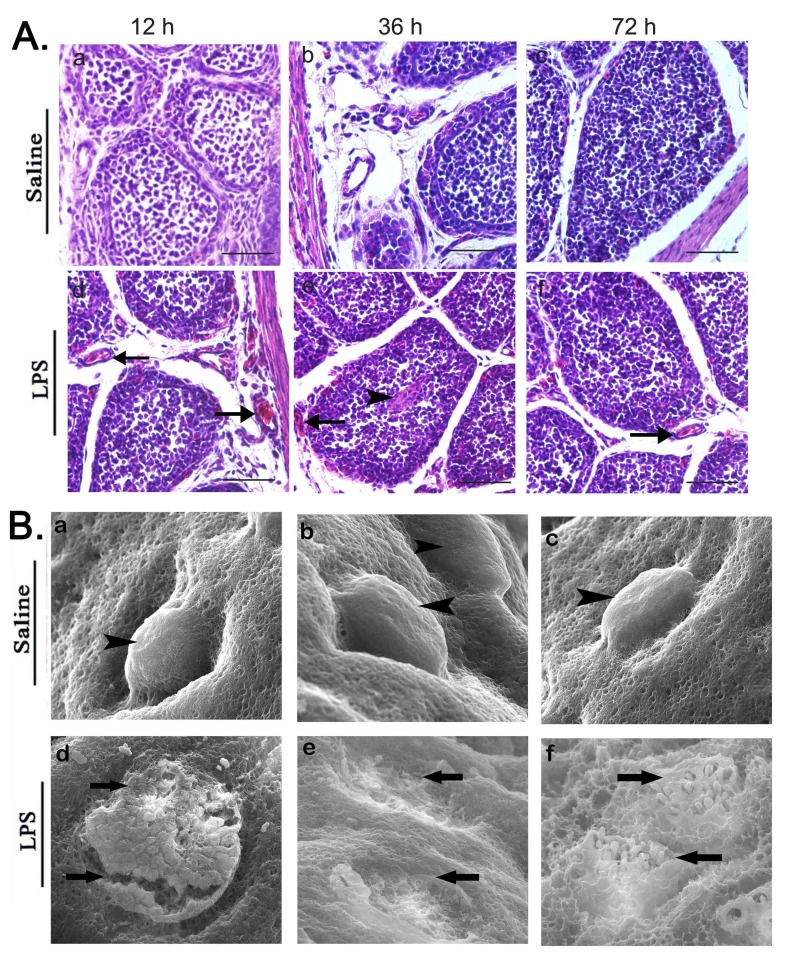
Figure 2. Analysis of bursal morphology after LPS treatment.
A. Representative images of H&E stained BF tissue sections at 12, 36 and 72 h after saline (control) or LPS i.p. injection. As shown, BF specimens from LPS-treated chicks show histopathological changes compared to the control. Arrows indicate blood vessel and arrow heads represent accumulation of RBC or inflammatory cells. Note: Scale bars = 50 μm. B. Representative scanning electron micrographs of BF sections at 12, 36 and 72 h after saline (control) or LPS i.p. injection showing the ultra structure of BF mucosal surface. Bursa tissue sections in LPS stimulated group show severe erosion and breaks in mucosal surface at 12 h, complete exuviation of bursal mucosal epithelial cells at 36 h and slight restoration of the disrupted mucosal surface at 72 h. Magnification = 500x. Arrowheads represent normal, smooth and intact bursal follicles on mucosal surface in saline group while arrows indicate broken, eroded and sloughed mucosal surface in LPS stimulated group. Data represent at least five tissue sections per chick per group (n = 3 at each time point).

