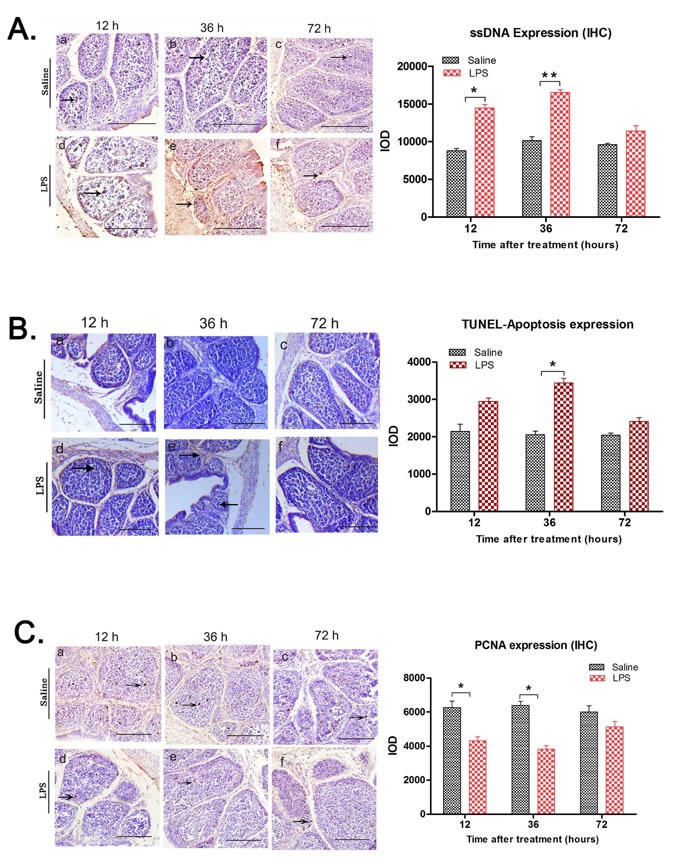
Figure 3. LPS treatment upregulates apoptosis and inhibits proliferation in chick BF.

A. Representative images of immunostaining with anti-ssDNA monoclonal antibody of BF tissue sections at 12, 36 and 72 h after saline (control) or LPS i.p. injection. Arrows show single stranded DNA (ssDNA) staining as a dark brown product (arrows). Integral optical density (IOD) analysis showed that in comparison to the saline group, ssDNA expression was upregulated in LPS treated group, especially at 12 (IOD ratio saline vs LPS; 8801:14453.67) and 36 h (IOD ratio saline vs LPS; 10135:16781.5). B. Representative images of TUNEL assay of BF tissue sections at 12, 36 and 72 h after saline (control) or LPS i.p. injection. Scale bars = 100 μm. IOD analysis shows increased TUNEL- positive (apoptotic) cells with brown stained nuclei in BF from LPS-treated chicks, especially at 36h time point (IOD ratio saline vs LPS; 2054.67:3439.67). C. Scale bars = 50μm. Serial tissue sections of chicken bursa of Fabricius were immuno-stained with PCNA antibody (proliferation marker) at 0h, 12 h, 36 h and 72 h post saline (control) or LPS stimulation C. Representative images of immunohistochemical staining of PCNA (proliferation) in BF tissue sections at 12, 36 and 72h after saline (control) or LPS i.p. injection. Arrows show PCNA positive signals as light brown dots. PCNA expression was downregulated in LPS treatment group compared to control. Integral optical density (IOD) of PCNA expression significantly decreased at 12 (IOD ratio saline vs LPS; 6266.67:4310) and 36 h (IOD ratio saline vs LPS; 6390:3822) after LPS treatment. Scale bars = 100μm; Note: * denotes P < 0.05; ** denotes P < 0.01. Data represent microscopic examination of at least five tissue sections per chick per group (n = 3 at each time point).
