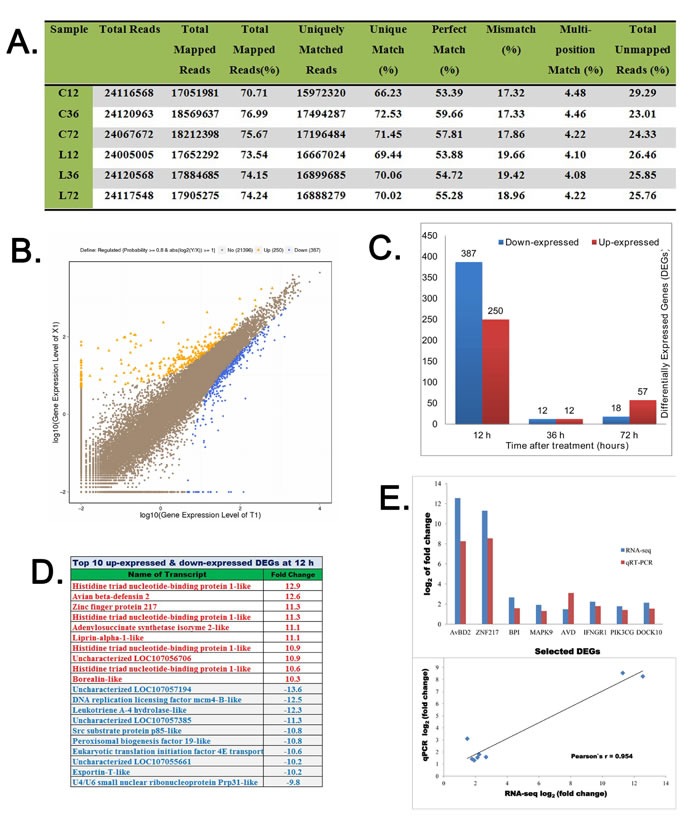
Figure 4. Analysis and validation of differentially expressed genes in LPS-treated chicken bursa.

A. Statistics of high-throughput sequencing reads aligned against reference genome. B. Scatter plot diagram showing log value of gene expression of LPS-treated BF samples (Y-axis) versus and log value of gene expression of saline treated BF samples (X-axis). The blue color indicates downregulated genes, orange color represents upregulated genes and brown color designates unchanged genes. Top legends on each figure show statistics of screening threshold values. C. The diagram shows total numbers of differential expressed genes (DEGs) at 12, 36 and 72h after saline or LPS treatments. D. Top 10 up-regulated and down-regulated DEGs at 12 h post saline or LPS treatments. The plus numbers designate upregulated log values while negative numbers represent downregulated log values of DEGs. E. Comparison and correlation analysis of log2 values of differential gene expression of eight genes (AvBD2, ZNF217, BPI, MAPK9, AVD, IFNGR1, PIK3CG and DOCK10) assessed by RNA-seq and qRT-PCR experiments.
